Why Most Chatbot Analytics Are Measured Wrong
Most organizations deploying chatbots track the wrong metrics -- a problem Gartner's analytics maturity research documents across 77% of organizations. They celebrate rising conversation volumes while ignoring whether those conversations actually help anyone. They report impressive deflection rates without verifying whether deflected users were actually satisfied or simply gave up. They track response times measured in milliseconds but never ask whether the responses were accurate or useful.
This measurement gap has real consequences. A 2026 survey by Forrester found that 61% of organizations cannot quantify the ROI of their chatbot investment, and 43% of chatbot projects are scaled back or abandoned within 18 months — not because the technology failed, but because stakeholders could not see evidence that it was working.
The problem is not a lack of data. Modern chatbot platforms generate enormous amounts of telemetry — every message, every click, every session is logged. The problem is knowing which data points actually matter, how to interpret them in context, and how to connect them to business outcomes that executives care about.
This guide introduces a structured framework of 15 chatbot metrics organized into four categories: Engagement (are people using it?), Performance (is it working well?), Business Impact (is it generating value?), and Advanced Analytics (where can we improve?). For each metric, we provide a clear definition, the formula for calculation, industry benchmarks, practical improvement strategies, and guidance on tracking setup.
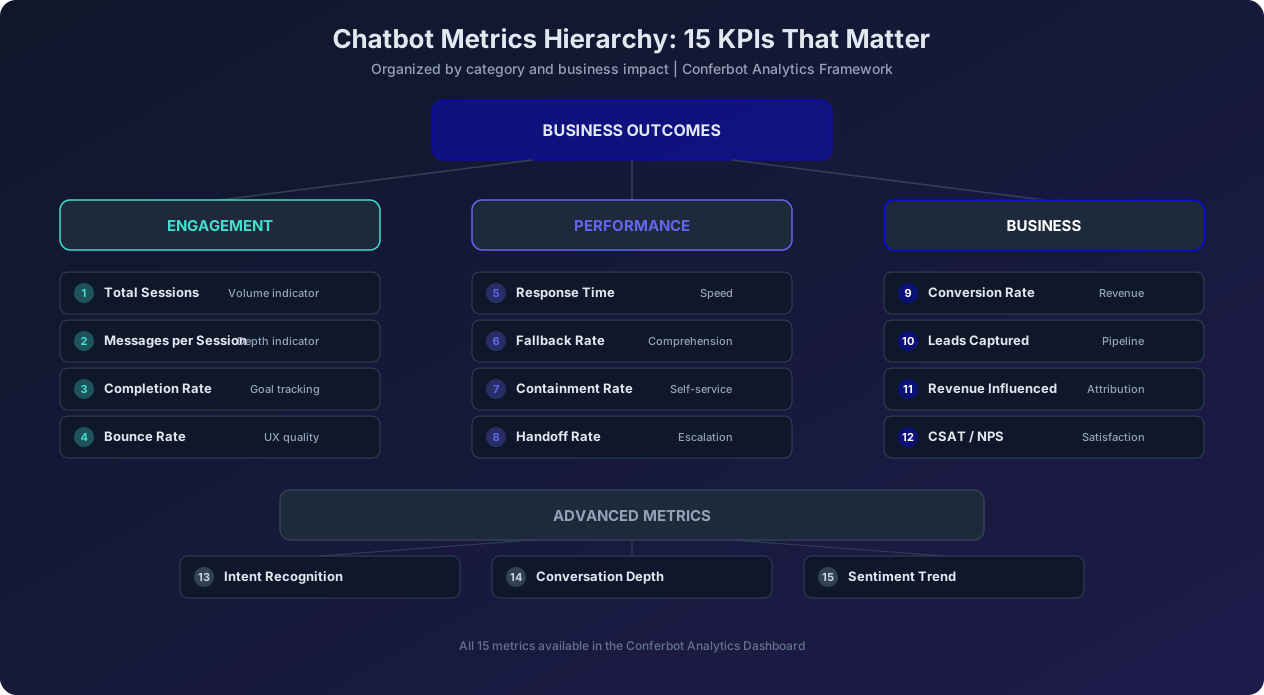
The hierarchy above illustrates how these metrics relate to each other. Engagement metrics form the foundation — without users engaging with the chatbot, nothing else matters. Performance metrics ensure the chatbot is functioning correctly. Business metrics connect chatbot activity to revenue and cost outcomes. And advanced metrics provide the diagnostic insight needed for continuous improvement.
Whether you are just launching your first chatbot or optimizing an established deployment, this framework will give you the measurement clarity you need to demonstrate value, identify problems early, and continuously improve your chatbot's impact on the business.
Engagement Metrics: Is Anyone Actually Using Your Chatbot?
Engagement metrics tell you whether users are finding and interacting with your chatbot. High engagement does not guarantee success, but without engagement, every other metric is irrelevant. These four metrics form the foundation of your analytics framework.
Metric 1: Total Sessions
Definition: The number of unique chatbot conversation sessions initiated within a given time period. A session begins when a user opens the chatbot widget or sends a first message and ends after a defined period of inactivity (typically 30 minutes) or when the user explicitly closes the chat.
Formula: Count of unique session IDs within the reporting period.
Benchmark: Varies dramatically by industry and traffic. As a percentage of website visitors, expect 5-15% engagement rate, which HubSpot's marketing data benchmarks at 2-5% for website widgets and 15-25% for proactive triggers on pages where the chatbot is deployed with proactive triggers, and 2-5% without proactive triggers. E-commerce sites average 8-12%, SaaS sites average 5-8%, and healthcare sites average 3-6%.
Why it matters: Total sessions is your volume metric — it tells you the size of the audience your chatbot is reaching. Tracking sessions over time reveals growth trends, seasonality patterns, and the impact of changes to chatbot placement or proactive messaging. A sudden drop in sessions may indicate technical issues (widget not loading), UX problems (trigger messages annoying users), or external factors (traffic decline).
How to improve:
- Proactive triggers: Implement page-specific trigger messages that invite users to engage. "Looking for pricing? I can walk you through our plans" converts 3x better than a generic "How can I help?" greeting.
- Strategic placement: Deploy the chatbot on high-intent pages (pricing, product, checkout) rather than every page. Focusing on high-intent pages increases the quality of sessions even if total volume is lower.
- Entry point design: Test different widget designs — bubble size, position, avatar, initial message — to find the combination that maximizes open rates for your audience.
- Cross-channel promotion: Mention the chatbot in email signatures, order confirmations, and support pages to drive awareness among existing customers.
Tracking setup: Most chatbot platforms track sessions automatically. In Conferbot, sessions are tracked with unique session IDs and are visible in the Analytics Dashboard under the Engagement tab. To integrate with your web analytics, fire a custom event (e.g., chatbot_session_started) to Google Analytics or your analytics platform when a session begins.
Metric 2: Messages per Session
Definition: The average number of messages exchanged (both user and bot messages) within a single session. This metric indicates conversation depth and engagement quality.
Formula: Total messages across all sessions / Total number of sessions.
Benchmark: The ideal messages-per-session varies by use case. For FAQ chatbots, 3-5 messages indicate efficient question answering. For sales chatbots, 6-10 messages suggest meaningful engagement with product exploration. For support chatbots, 5-8 messages is healthy. Below 2 messages often indicates bounce or frustration. Above 15 messages may indicate the chatbot is struggling to resolve the query or the user is going in circles.
Why it matters: Messages per session reveals engagement depth. Very low values (1-2) suggest users are testing the chatbot and leaving unimpressed. Very high values (15+) may indicate the chatbot is failing to provide resolution and users are rephrasing their questions repeatedly. The sweet spot depends on your chatbot's purpose, but tracking trends matters more than absolute numbers — if messages per session suddenly increases by 40%, something may have broken.
How to improve:
- If too low: Improve opening messages to encourage further interaction. Use follow-up questions like "Would you like to know more about pricing or features?" to guide the conversation forward.
- If too high: Analyze conversations with 15+ messages to identify patterns. Common causes include poor intent classification (chatbot misunderstands the question), missing knowledge base content, and conversation loops where the chatbot keeps asking for clarification.
- Optimize conversation design: Reduce unnecessary back-and-forth by presenting options (buttons, carousels) instead of asking open-ended questions when the set of possible answers is finite.
Metric 3: Completion Rate
Definition: The percentage of chatbot conversations that reach their intended goal or endpoint. Goals vary by chatbot type: submitting a contact form, completing a booking, reaching the final FAQ answer, or resolving a support issue.
Formula: (Sessions reaching a defined goal / Total sessions) x 100.
Benchmark: For lead generation chatbots, 20-35% completion rate is strong. For FAQ chatbots, 65-80% completion. For booking chatbots, 15-30% completion. For support chatbots, 55-75% completion. These benchmarks assume well-designed conversation flows — poorly designed chatbots may see completion rates below 10%.
Why it matters: Completion rate is the single best indicator of whether your chatbot is doing its job. High sessions with low completion means users are engaging but the chatbot is failing to deliver value. This metric directly connects engagement to outcomes and should be the primary KPI reported to business stakeholders.
How to improve:
- Identify drop-off points: Analyze where in the conversation flow users abandon. If 60% drop off at the email collection step, that step needs redesign (perhaps make it optional or explain why the email is needed).
- Reduce steps: Every additional step in a conversation flow reduces completion by approximately 8-15%. Eliminate unnecessary questions and combine steps where possible.
- Provide value before asking: Answer the user's question or provide useful information before requesting personal details. Users are more willing to share information after receiving value.
Metric 4: Bounce Rate
Definition: The percentage of sessions where the user sends zero or one messages before leaving. A bounced session indicates the user opened the chatbot but immediately disengaged — they found the opening message unhelpful, the chatbot was not what they expected, or a technical issue prevented interaction.
Formula: (Sessions with 0-1 user messages / Total sessions) x 100.
Benchmark: A healthy chatbot bounce rate is 10-20%. Rates above 30% indicate significant UX or relevance issues. Rates below 10% are exceptional and typically seen in chatbots with strong proactive targeting that reaches the right users at the right time.
Why it matters: Bounce rate is your early warning system. It captures the users who tried your chatbot and immediately decided it was not worth their time. High bounce rates waste the traffic you are sending to the chatbot and indicate that the first impression is failing. Since first impressions are formed in seconds, bounce rate is primarily influenced by the chatbot's opening message, visual design, and load speed.
How to improve:
- Test opening messages: A/B test different greeting messages. Specific, value-focused openings ("I can help you find the right plan and pricing") outperform generic ones ("Hello! How can I help you today?") by 40-60% in bounce rate reduction.
- Reduce load time: If the chatbot widget takes more than 2 seconds to load and become interactive, many users will click away. Optimize widget code and use CDN delivery.
- Match user intent: Use page-specific chatbot configurations. A visitor on the pricing page should see pricing-relevant opening messages, not a generic FAQ bot.
- Provide quick options: Display 3-4 clickable quick-reply buttons with common topics below the greeting message. Users who are unsure what to type often engage when given clear starting options.
Performance Metrics: Is Your Chatbot Working Correctly?
Performance metrics measure the technical and operational effectiveness of your chatbot. Good engagement means nothing if the chatbot is slow, confused, or constantly escalating to humans. These four metrics reveal whether the chatbot is functioning as designed.
Metric 5: Response Time
Definition: The time elapsed between a user sending a message and the chatbot's response appearing in the interface. Measured in milliseconds or seconds. Track both average response time and percentile distributions (P50, P90, P99) to understand the typical experience versus worst-case scenarios.
Formula: Timestamp of bot response - Timestamp of user message. Report as median (P50), P90, and P99.
Benchmark: For rule-based responses, P50 should be under 100ms. For LLM-generated responses without streaming, P50 should be under 2 seconds. For LLM responses with streaming, time-to-first-token should be under 500ms. P99 (worst case) should not exceed 5 seconds for any response type. Users perceive responses under 1 second as "instant" and responses over 3 seconds as "slow."
Why it matters: Response time directly affects user satisfaction and completion rates. Research shows that chatbot satisfaction drops by 15% for every additional second of response latency beyond the 1-second mark. Slow chatbots feel unresponsive and drive users to abandon conversations for phone or email support, defeating the purpose of the chatbot deployment.
How to improve:
- Implement streaming: Display LLM-generated text as it is produced rather than waiting for the complete response. This reduces perceived latency by 60-80%.
- Add semantic caching: Cache responses to common questions. A cache hit responds in under 50ms instead of 800ms+ for an LLM call.
- Use tiered processing: Route simple queries to rule-based or small-model paths that respond in milliseconds.
- Monitor degradation: Set up alerts for P99 response times exceeding 5 seconds. Latency spikes often indicate infrastructure issues, API rate limiting, or knowledge base indexing problems.
Metric 6: Fallback Rate
Definition: The percentage of user messages that trigger a fallback response — the chatbot's generic "I do not understand" or "Could you rephrase that?" reply that indicates it could not classify the intent or find relevant information. Some platforms call this the "confusion rate" or "unrecognized intent rate."
Formula: (Messages triggering fallback response / Total user messages) x 100.
Benchmark: A well-trained chatbot should have a fallback rate below 15%. Rates of 10% or lower indicate excellent coverage. Rates above 25% indicate significant gaps in the chatbot's training data, knowledge base, or conversation design. For new deployments, fallback rates of 20-30% are normal in the first month and should decrease as you add coverage for unrecognized topics.
Why it matters: Every fallback response is a failure point where the chatbot admits it cannot help. High fallback rates frustrate users, damage trust in the chatbot, and increase the workload on human agents who must handle escalated conversations. Fallback rate is your most actionable performance metric because every fallback message reveals a specific topic or phrasing that your chatbot needs to learn.
How to improve:
- Analyze fallback logs: Review every message that triggered a fallback to identify patterns. Often, a small number of topics (5-10) account for 60-80% of fallbacks.
- Expand the knowledge base: Add content covering the most common fallback topics. Each knowledge base addition typically reduces fallback rate by 2-5 percentage points.
- Improve intent training: Add more training examples for existing intents, particularly alternative phrasings and colloquial language.
- Add graceful degradation: Instead of a generic "I do not understand," provide partial answers or related topic suggestions. "I am not sure about that specific question, but I can help with pricing, features, or getting started — which would be most helpful?"
Metric 7: Containment Rate
Definition: The percentage of conversations that the chatbot resolves entirely without human agent involvement. Also called "self-service rate" or "automation rate." A contained conversation is one where the user gets their answer or completes their task entirely through the chatbot without requesting or being transferred to a human.
Formula: (Conversations resolved by chatbot alone / Total conversations) x 100.
Benchmark: Industry average containment rate is 55-65%. Well-optimized chatbots achieve 70-80%. Best-in-class deployments with comprehensive knowledge bases and well-designed flows reach 80-90%. For support chatbots, containment above 70% is considered excellent. For sales chatbots, 40-60% containment is healthy since complex sales conversations often benefit from human involvement.
Why it matters: Containment rate is the primary metric for measuring chatbot ROI in support applications. Every contained conversation represents a support ticket that did not require a human agent, directly translating to cost savings. At an average fully-loaded cost of $7-12 per human-handled support interaction, improving containment rate from 60% to 80% on 10,000 monthly conversations saves $14,000-$24,000 per month.
How to improve:
- Expand self-service capabilities: Identify the most common reasons for human escalation and build chatbot capabilities to handle them. Common wins include adding password reset flows, order status lookups, and appointment scheduling.
- Improve answer quality: Conversations escalate when the chatbot's answers are not sufficiently helpful. Enhance knowledge base content with more detailed, step-by-step instructions rather than brief summary answers.
- Add transactional capabilities: Many escalations happen because users need to take an action (change a booking, update an address) that the chatbot cannot perform. Adding API integrations that allow the chatbot to execute transactions eliminates these escalations.
Metric 8: Handoff Rate
Definition: The percentage of conversations that are transferred to a human agent, whether by user request or chatbot initiation. Handoff rate is the inverse perspective of containment rate but provides additional insight when broken down by handoff reason.
Formula: (Conversations transferred to human agents / Total conversations) x 100.
Benchmark: Target handoff rate of 15-25% for support chatbots and 30-45% for sales chatbots (where human involvement in closing is often desirable). Handoff rates above 40% for support chatbots suggest the chatbot is not providing sufficient value. Handoff rates below 10% may indicate the chatbot is not escalating conversations that should be escalated, potentially frustrating users who need human help.
Why it matters: Handoff rate tells you how often the chatbot hits its limits. But the real insight comes from analyzing handoff reasons: Are users requesting handoff because they are frustrated? Is the chatbot proactively escalating complex issues? Are there specific topics that consistently require human handling? This analysis reveals where to invest in chatbot improvement and where human involvement genuinely adds value.
How to improve:
- Categorize handoff reasons: Tag every handoff with a reason category (user requested, chatbot confidence low, topic not covered, emotional escalation, transaction required). This data directs improvement efforts.
- Reduce frustration-driven handoffs: If users are requesting handoff because the chatbot is going in circles, improve conversation design for those flows. Add escape hatches at every point in the conversation.
- Accept strategic handoffs: Not all handoffs are failures. For high-value sales conversations and complex complaints, proactive handoff to a skilled human agent may actually improve outcomes. Track handoff success rate (did the human agent resolve the issue?) alongside handoff rate.
Business Metrics: Is Your Chatbot Generating Real Value?
Business metrics connect chatbot activity to the outcomes that matter to executives and stakeholders: revenue, leads, customer satisfaction, and cost savings. These metrics justify your chatbot investment and guide strategic decisions about where to expand chatbot capabilities.
Metric 9: Conversion Rate
Definition: The percentage of chatbot conversations that result in a desired business outcome — a purchase, signup, subscription, booking, or other defined conversion event. This is the metric that directly ties chatbot engagement to revenue.
Formula: (Conversations resulting in a conversion / Total conversations) x 100.
Benchmark: Chatbot conversion rate -- the metric that McKinsey's personalization research ties directly to revenue impact in digital channelss vary dramatically by industry and conversion type. E-commerce product purchase: 2-5%. SaaS free trial signup: 4-8%. Appointment booking: 6-12%. Lead form submission: 15-25%. Restaurant reservation: 10-15%. The key benchmark is comparison against your non-chatbot conversion rate — chatbot-assisted conversions should be at least 1.5x higher than unassisted conversions on the same pages.
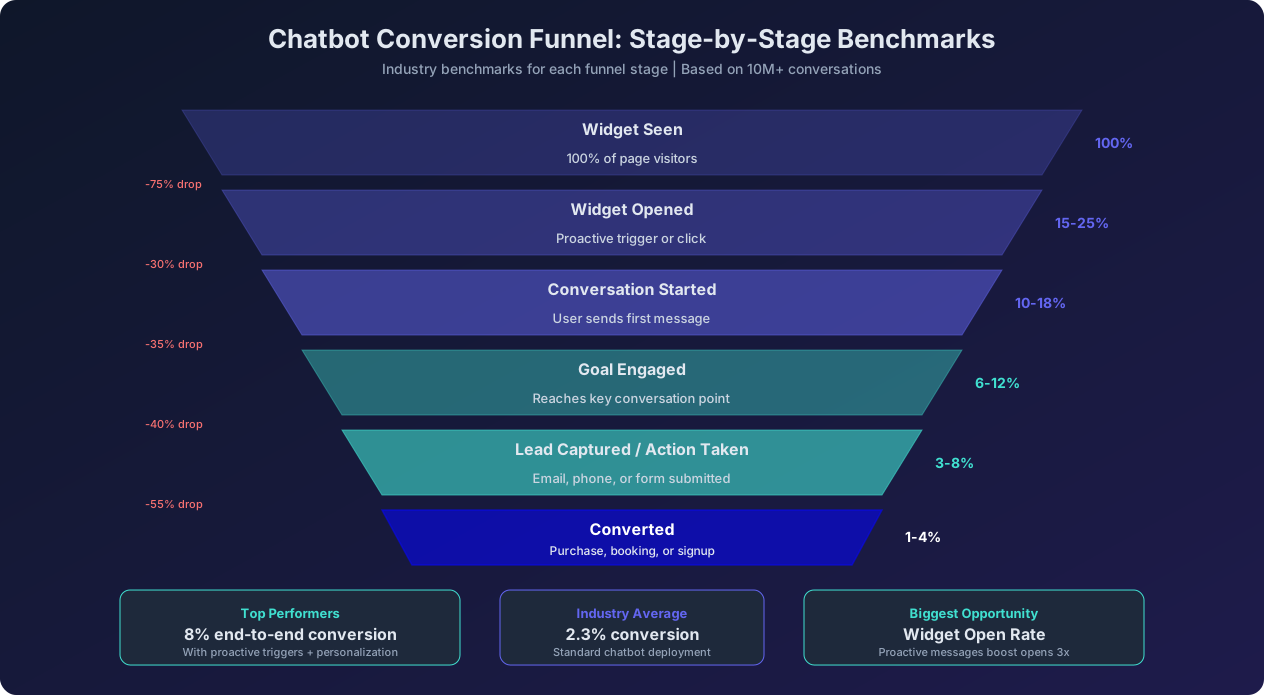
Why it matters: Conversion rate is the ultimate measure of chatbot effectiveness for revenue-generating use cases. A chatbot with high engagement but low conversion is an expensive distraction. Tracking conversion by traffic source, page, conversation flow, and user segment reveals which chatbot interactions drive the most value and where optimization efforts should focus.
How to improve:
- Optimize the funnel: Use the conversion funnel chart above to identify your biggest drop-off point. The largest single improvement usually comes from increasing the Widget Opened rate through better proactive triggers.
- Reduce friction: Minimize the steps between engagement and conversion. If the chatbot can pre-fill forms with information gathered during conversation, do it.
- Add urgency and social proof: "12 people booked this in the last hour" and "This price is available for the next 2 hours" drive faster decisions when used truthfully.
- Personalize based on behavior: A returning visitor who previously explored premium plans should see a conversation flow tailored to premium features, not the generic pricing overview.
Metric 10: Leads Captured
Definition: The number of qualified leads (contact information plus qualifying data) collected through chatbot conversations. A captured lead includes at minimum an email address or phone number, along with the conversational context about what the lead is interested in.
Formula: Count of conversations where contact information was voluntarily provided and the lead meets minimum qualification criteria.
Benchmark: Lead capture rates (leads captured / total conversations) range from 8-15% for general website chatbots and 20-35% for targeted landing page chatbots. Quality matters more than quantity — track lead-to-opportunity and lead-to-customer conversion rates downstream to ensure chatbot leads are genuinely qualified.
Why it matters: For B2B companies and high-consideration purchases, the chatbot's primary conversion event is often lead capture rather than direct purchase. Every qualified lead has a calculable pipeline value based on your average deal size and close rate. If your chatbot captures 500 leads per month with a 10% close rate and $5,000 average deal size, that represents $250,000 in monthly pipeline directly attributable to the chatbot.
How to improve:
- Lead magnet integration: Offer something valuable in exchange for contact information — a personalized recommendation, a PDF guide, or a custom quote.
- Progressive profiling: Collect information gradually across multiple interactions rather than asking for everything in one conversation. First visit: email. Return visit: company and role. Third visit: specific needs and timeline.
- Qualification in conversation: Use natural conversation to qualify leads (budget, timeline, decision-making authority, specific needs) so sales teams receive context-rich leads rather than raw contact details.
Metric 11: Revenue Influenced
Definition: The total revenue from transactions where the chatbot was involved at any point in the customer journey. This includes direct chatbot-assisted purchases, leads captured by the chatbot that later converted, and customers who received chatbot support that influenced their purchase decision.
Formula: Sum of revenue from all transactions where the customer had a chatbot interaction within the attribution window (typically 30 days).
Benchmark: Revenue attribution varies by business model. E-commerce chatbots typically influence 5-15% of total site revenue. B2B chatbots may influence 20-40% of pipeline revenue through lead qualification and nurturing. The key metric is the incremental lift — compare conversion rates and average order values for visitors who engaged with the chatbot versus those who did not.
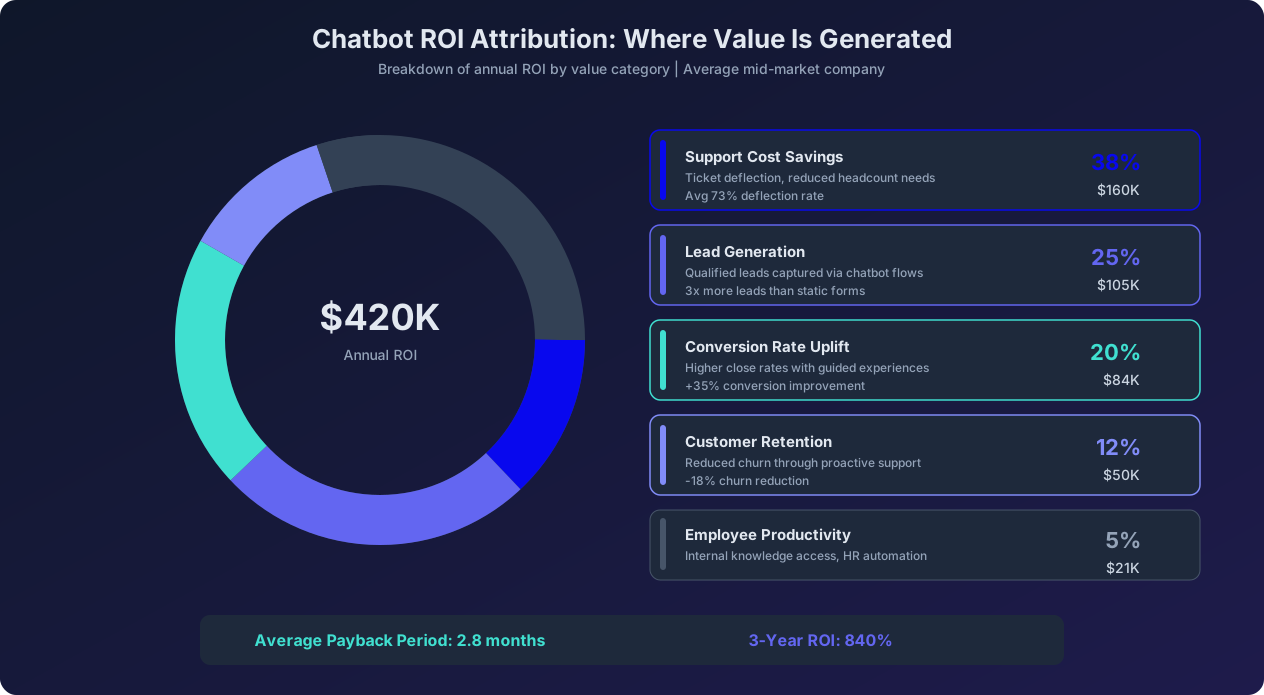
Why it matters: Revenue influenced is the metric that justifies chatbot investment to the C-suite. It translates chatbot activity into the language of business impact. When you can demonstrate that the chatbot influenced $500K in quarterly revenue against a $3K monthly platform cost, the ROI case writes itself.
How to improve:
- Implement proper attribution: Use unique session IDs and customer IDs to track the chatbot's involvement across the entire customer journey, not just the immediate transaction.
- Expand chatbot touchpoints: Deploy the chatbot at more stages of the buying journey — product exploration, comparison, checkout, and post-purchase — to increase the opportunities for revenue influence.
- Track assisted conversions: Many chatbot interactions assist a future conversion rather than being the direct point of conversion. Include assisted conversions (chatbot interaction followed by conversion within 7-30 days) in your attribution model.
Metric 12: Customer Satisfaction (CSAT / NPS)
Definition: Customer satisfaction measurement specifically for chatbot interactions. CSAT (Customer Satisfaction Score) asks users to rate their experience on a scale (typically 1-5 stars) immediately after the interaction. NPS (Net Promoter Score) measures likelihood to recommend the service.
Formula: CSAT: Average of post-interaction ratings. NPS: % Promoters (9-10) minus % Detractors (0-6) on a 0-10 scale.
Benchmark: For chatbot interactions specifically, CSAT of 4.0/5 or higher is good, 4.3/5 or higher is excellent. NPS of +30 is good, +50 is excellent. These benchmarks are lower than general customer service benchmarks because users still hold chatbots to a slightly lower expectation than human agents, though this gap is narrowing rapidly as chatbot quality improves.
Why it matters: CSAT and NPS directly predict customer retention and lifetime value. A 1-point improvement in CSAT (on a 5-point scale) correlates with a 12-18% increase in customer retention rate. For subscription businesses, this retention improvement translates directly to recurring revenue growth.
How to improve:
- Analyze low-rating conversations: Read every conversation that receives a 1 or 2-star rating. These conversations reveal specific failure modes that, when fixed, have an outsized impact on overall satisfaction.
- Improve first-contact resolution: Users who get their issue resolved in one chatbot session rate their experience 2x higher than those who need multiple sessions or escalation to a human agent.
- Add empathy markers: Chatbot responses that acknowledge the user's frustration or urgency ("I understand this is time-sensitive, let me help you right away") improve satisfaction scores by 15-20% without changing the actual resolution.
- Optimize the timing of the CSAT survey: Ask for ratings after resolution, not during the conversation. Post-resolution surveys get higher response rates and more accurate satisfaction data.
Advanced Metrics: Diagnosing and Optimizing Your Chatbot
The final three metrics provide diagnostic depth for chatbot teams that want to move beyond basic reporting into continuous optimization. These metrics require more sophisticated tracking but reveal the specific areas where improvement will have the highest impact.
Metric 13: Intent Recognition Accuracy
Definition: The percentage of user messages where the chatbot correctly identifies the user's intent. This is measured by comparing the chatbot's classified intent against the actual intent as determined by human reviewers on a sample of conversations.
Formula: (Correctly classified intents / Total sampled messages) x 100.
Benchmark: For chatbots using LLM-based intent classification, accuracy of 90-95% is achievable and expected. For rule-based or traditional NLU intent classification, 80-90% is typical. Accuracy below 80% indicates fundamental issues with the chatbot's language understanding that will cascade into poor performance across all other metrics.
Why it matters: Intent recognition is the foundation of everything the chatbot does. If the chatbot misunderstands what the user is asking, every subsequent step — retrieval, response generation, action execution — will be wrong regardless of how well those components function individually. A chatbot with 85% intent accuracy will get roughly 15% of conversations off to a wrong start, leading to frustration, fallbacks, and escalations.
How to track: Sample 100-200 conversations weekly and have team members label the actual intent of each user message. Compare these labels against the chatbot's classification. Track accuracy overall and by intent category to identify which intents are most commonly misclassified. Automated evaluation using LLM-as-judge (where a separate LLM evaluates the chatbot's classifications) can scale this process for larger conversation volumes.
How to improve:
- Add training examples for confused intents: When two intents are frequently confused (e.g., "cancel subscription" vs "pause subscription"), add more training examples that clearly differentiate them.
- Merge overlapping intents: If two intents consistently confuse the classifier and lead to similar responses, merge them into a single intent with a broader definition.
- Use disambiguation: When the chatbot's confidence in intent classification is low (below a threshold), ask a clarifying question rather than guessing wrong. "Are you looking to cancel your subscription or pause it temporarily?" is better than guessing wrong.
Metric 14: Conversation Depth
Definition: A composite metric measuring how far conversations progress through their intended flow. Unlike messages-per-session (which counts raw messages), conversation depth tracks progression through meaningful stages — initial greeting, problem identification, solution exploration, resolution, and follow-up.
Formula: Average of (conversation stages completed / total conversation stages) across all sessions. Express as a percentage or as a ratio (e.g., 3.2/5 stages).
Benchmark: For a 5-stage conversation flow, average depth of 3.5-4.0 stages indicates healthy engagement. Depth below 2.0 suggests users are abandoning early. Depth consistently at 5.0 indicates users are completing the full flow, which is ideal for structured processes like bookings or onboarding but may indicate the flow is too short for support scenarios.
Why it matters: Conversation depth reveals the quality of engagement more precisely than raw message count. A conversation with 10 messages that only reached stage 2 (problem identification) is very different from a conversation with 10 messages that reached stage 4 (resolution). Tracking depth by flow type, user segment, and time of day reveals patterns that guide conversation design optimization.
How to track: Define 4-6 meaningful stages for each conversation flow in your chatbot. Instrument each stage with a tracking event that fires when the conversation reaches that point. Aggregate stage completion data to calculate average depth. In Conferbot, conversation stages are defined in the flow builder and tracked automatically.
How to improve:
- Identify the critical drop-off stage: Most flows have one stage where disproportionate drop-off occurs. Focus optimization efforts on that specific stage.
- Add progress indicators: For multi-stage flows, showing users their progress ("Step 2 of 4") increases completion by 10-15%.
- Reduce perceived complexity: If a conversation flow has 8 stages, users may feel overwhelmed. Group stages into 3-4 visible phases while maintaining the underlying detail.
Metric 15: Sentiment Trend
Definition: The distribution and trajectory of user sentiment (positive, neutral, negative) across chatbot conversations over time. Measured using sentiment analysis on user messages within conversations, typically classified by an LLM or specialized sentiment model.
Formula: For each conversation, classify the final user sentiment as positive, neutral, or negative. Track the percentage distribution and trend line for each category over time. Also calculate the sentiment shift — the change in sentiment from the beginning to the end of each conversation.
Benchmark: Healthy chatbot sentiment distribution: 55-65% positive, 25-35% neutral, 10-15% negative. Sentiment should trend positive over time as the chatbot improves. The most important benchmark is the sentiment shift: conversations that start neutral or negative should end neutral or positive at least 60% of the time, indicating the chatbot is helping resolve issues rather than compounding frustration.
Why it matters: Sentiment trend is a leading indicator of customer satisfaction and retention issues. A gradual shift toward more negative conversations, even if absolute numbers remain within benchmarks, signals emerging problems — perhaps a recent product change is causing frustration, a policy update is confusing customers, or a chatbot update has degraded response quality. Detecting sentiment shifts early allows you to intervene before they impact CSAT scores and churn rates.
How to track: Implement automated sentiment analysis on user messages using an LLM-based classifier or a specialized sentiment model. Track sentiment at the message level and aggregate to conversation and period levels. Build a dashboard view showing sentiment distribution over time with drill-down capability to read specific negative-sentiment conversations.
How to improve:
- Address negative-sentiment topics: Cluster negative-sentiment conversations by topic to identify the primary drivers of dissatisfaction. Fix the root causes (product issues, policy confusion, missing information) rather than just improving the chatbot's responses.
- Improve empathy in escalation paths: Conversations that escalate to human agents often have the most negative sentiment. Ensure the handoff experience is smooth and the chatbot acknowledges the user's frustration before transferring.
- Add sentiment-aware responses: Configure the chatbot to detect negative sentiment in real-time and adjust its tone — speaking more empathetically, offering to connect with a human, or proactively offering solutions when frustration is detected.
Designing Your Chatbot Analytics Dashboard
A well-designed analytics dashboard, following data visualization principles from Tableau's visualization research transforms raw data into actionable insight. Here is a practical guide to building a chatbot analytics dashboard that serves both daily operators and monthly executive reviewers.
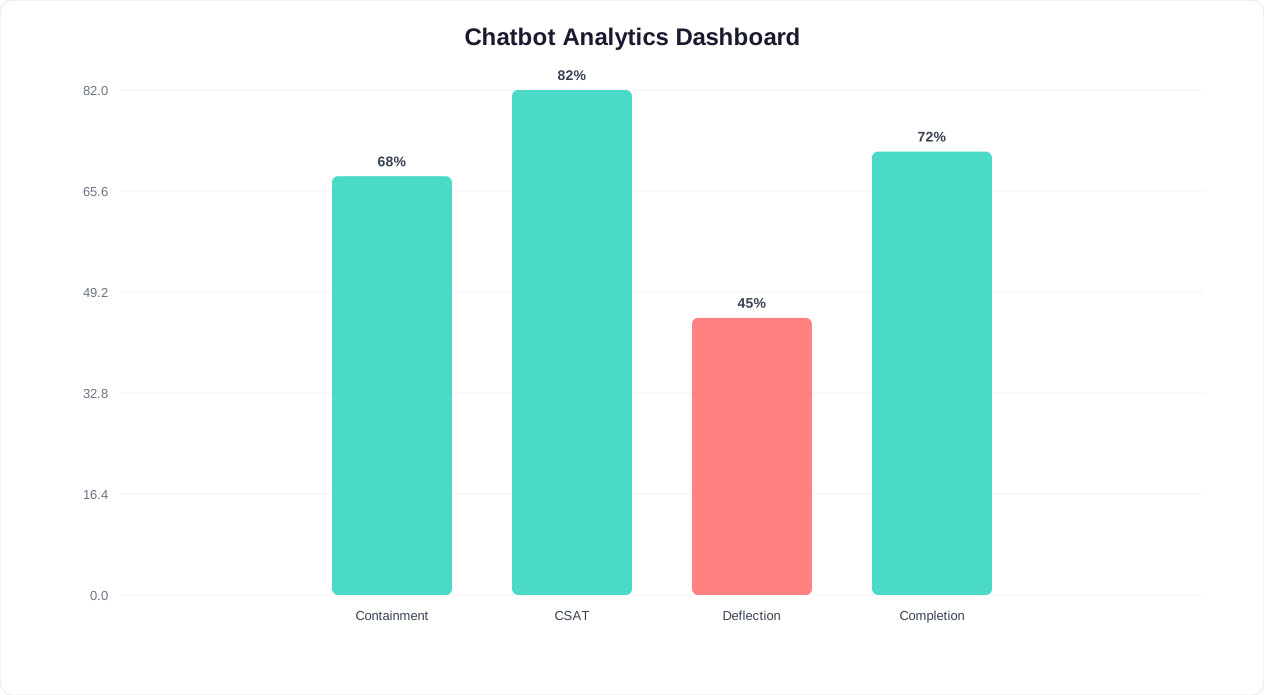
Dashboard Structure: Three Tiers
Tier 1: Executive Summary (Top of Dashboard)
The top section displays 5-6 headline KPIs as large, scannable cards with trend indicators. These are the numbers that tell leadership whether the chatbot is healthy at a glance:
- Total Sessions (with week-over-week percentage change)
- Conversion Rate (with trend arrow)
- Containment Rate (with trend arrow)
- CSAT Score (with trend arrow)
- Leads Captured (with week-over-week count change)
- Average Response Time (with trend arrow)
Each card should use color coding — green for metrics trending positively, red for concerning trends, and neutral for stable metrics. Include a comparison period (vs. last week, vs. last month) to provide immediate context.
Tier 2: Trend Analysis (Middle Section)
The middle section provides time-series visualizations that reveal patterns and trends. Essential charts include:
- Sessions and Conversions over Time: A dual-line chart showing session volume and conversion count over the past 7, 30, or 90 days. This reveals traffic patterns, seasonal trends, and the relationship between volume and conversions.
- Top Intents: A ranked list or bar chart of the most common user intents, updated in real time. This shows what users are asking about most and helps identify emerging topics or issues.
- Conversation Funnel: A visual funnel showing drop-off at each stage from widget opening to conversion. This immediately highlights the biggest optimization opportunity.
Tier 3: Diagnostic Detail (Bottom Section)
The bottom section provides diagnostic detail for chatbot operators who need to identify and fix specific issues:
- Performance Breakdown: Horizontal bar charts showing fallback rate, handoff rate, completion rate, sentiment distribution, and intent match rate. These operational metrics guide daily optimization work.
- Recent Conversation Feed: A live feed of recent conversations with sentiment tags and outcome labels, with the ability to click through to full transcripts. This keeps operators connected to the real user experience rather than just aggregate numbers.
- Alert Panel: A section highlighting metrics that have crossed threshold boundaries (fallback rate above 20%, response time spike, sudden sentiment drop), drawing immediate attention to issues that need investigation.
Reporting Cadence
Different stakeholders need different reporting frequencies:
- Daily (Chatbot operators): Monitor the dashboard for anomalies, review flagged conversations, check alert panel, and make incremental improvements to conversation flows and knowledge base.
- Weekly (Product and support managers): Review week-over-week trends across all 15 metrics, analyze the top 10 unresolved intents, assess A/B test results, and prioritize optimization tasks for the coming week.
- Monthly (Executive leadership): Present a one-page summary with revenue influenced, cost savings from containment, CSAT trend, and progress toward quarterly chatbot goals. Connect every metric to a dollar value or business outcome.
Building the Dashboard
For teams using Conferbot, the Analytics Dashboard provides all 15 metrics out of the box with the three-tier layout described above. For custom implementations, common dashboard tools include:
- Conferbot Analytics: Built-in, zero-setup dashboard with all chatbot metrics, funnel visualization, and conversation review tools
- Looker / Google Data Studio: Connect via data export for custom visualizations and cross-platform reporting
- Metabase: Open-source option that connects directly to your analytics database for fully custom dashboards
- Mixpanel / Amplitude: Product analytics platforms that support chatbot event tracking alongside broader product analytics
Industry Benchmarks: How Your Chatbot Compares
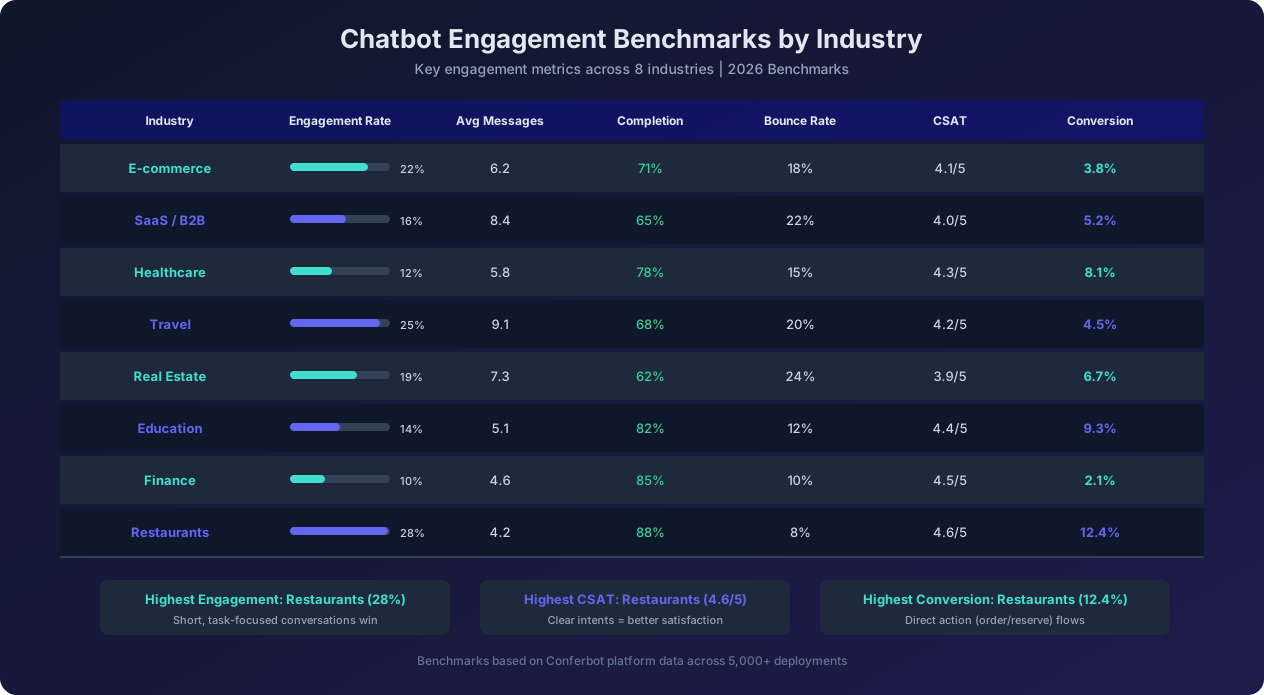
Benchmarks are only useful when they are specific to your context. A 4% conversion rate is excellent for an e-commerce chatbot but disappointing for a restaurant reservation bot. The following benchmarks, drawn from the Conferbot platform across 5,000+ chatbot deployments, provide realistic targets for each industry.
Key Takeaways from Industry Benchmarks
High-engagement industries (Restaurants, Travel, E-commerce): These industries benefit from clear user intent — visitors know what they want (a reservation, a trip, a product) and chatbots that facilitate quick task completion see the highest engagement rates (22-28%) and conversion rates. The winning strategy is removing friction from the transaction process rather than trying to create longer, more elaborate conversations.
High-completion industries (Finance, Restaurants, Education): Industries where the conversation flow is structured and the set of possible outcomes is limited see the highest completion rates (82-88%). Financial chatbots handling balance inquiries and transaction lookups, restaurant bots handling reservations, and education bots handling enrollment questions all benefit from clear, predictable conversation paths.
High-conversion industries (Restaurants, Education, Real Estate): The highest conversion rates appear in industries where the chatbot can directly complete the transaction (restaurant reservations, course enrollment) or where the high-intent nature of the visitor population increases conversion probability (real estate inquiries from active buyers). Conversion rates of 8-12% in these industries demonstrate the chatbot's value as a direct revenue driver.
Deeper conversations (Travel, SaaS, Real Estate): Industries involving complex decisions and high-value transactions show higher average messages per session (7-9 messages). This is healthy — these conversations represent genuine engagement with consideration-stage buyers. For these industries, optimizing for conversation quality (helpful recommendations, detailed comparisons) matters more than optimizing for conversation brevity.
Setting Your Own Benchmarks
While industry benchmarks sourced from Statista's chatbot industry data provide a starting reference, the most valuable benchmarks are your own historical baselines. To establish meaningful internal benchmarks:
- Measure for 30 days before optimizing. Resist the urge to change everything in the first week. Establish a baseline across all 15 metrics before making changes.
- Set targets relative to your baseline. A 20% improvement in your weakest metric is more valuable than chasing an industry benchmark on a metric that is already strong.
- Segment your benchmarks. Overall averages hide important patterns. Track benchmarks separately by traffic source (organic vs. paid vs. direct), page type (product vs. pricing vs. support), device (mobile vs. desktop), and time of day (business hours vs. after hours).
- Update benchmarks quarterly. As your chatbot improves, your benchmarks should increase to maintain momentum and prevent complacency.
Weekly Reporting Template and Action Framework
A consistent weekly reporting cadence ensures chatbot performance is continuously monitored and improved. Here is a practical template that takes 30 minutes to complete and provides the insight needed for effective weekly optimization.
Weekly Chatbot Performance Report Template
Section 1: Headline Numbers (5 minutes)
Record this week's values and week-over-week change for the five most important metrics. Present these at the top of every report so stakeholders can immediately assess chatbot health:
- Total Sessions: [number] ([+/-]% WoW)
- Conversion Rate: [number]% ([+/-] percentage points WoW)
- Containment Rate: [number]% ([+/-] percentage points WoW)
- CSAT Score: [number]/5 ([+/-] WoW)
- Revenue Influenced: $[number] ([+/-]% WoW)
Section 2: What Changed (10 minutes)
Identify the 2-3 most significant changes from the previous week and provide brief analysis of each. Examples of notable changes:
- Fallback rate increased from 12% to 18% — analysis reveals 60% of new fallbacks relate to a recently launched product feature that is not yet covered in the knowledge base.
- Conversion rate on pricing page chatbot increased from 3.1% to 4.8% after implementing the new comparison table conversation flow.
- After-hours sessions increased 25% following deployment of proactive triggers on high-traffic pages.
Section 3: Top Unresolved Issues (10 minutes)
List the top 5-10 conversation topics where the chatbot is failing — high fallback rates, low satisfaction, frequent escalation. For each, note the volume (number of conversations affected) and the proposed fix:
- "Refund status check" — 340 conversations, 78% escalation rate. Fix: Add order management API integration to enable chatbot to look up refund status directly.
- "Product comparison" — 220 conversations, 45% fallback rate. Fix: Create comprehensive comparison content for top 10 product pairs in the knowledge base.
- "Billing dispute" — 180 conversations, 92% escalation rate. Fix: Acceptable — complex billing disputes require human judgment. Improve handoff experience with better context transfer.
Section 4: Actions This Week (5 minutes)
Based on the analysis, define 2-3 specific actions for the coming week. Each action should be specific, assignable, and completable within one week:
- Action 1: Add knowledge base content for [new product feature] — Owner: [name] — Due: [date]
- Action 2: A/B test new greeting message on pricing page — Owner: [name] — Due: [date]
- Action 3: Review and optimize the top 5 escalation conversation flows — Owner: [name] — Due: [date]
The Improvement Loop
The weekly report creates a continuous improvement loop: measure (what happened), analyze (why it happened), act (what we will change), and verify (did the change work). Teams that follow this cadence consistently improve their chatbot's containment rate by 2-3 percentage points per month for the first 6 months and 1-2 points per month thereafter, while teams without structured reporting typically plateau within 60-90 days of launch.
The most impactful insight often comes from reading actual conversations rather than studying aggregate metrics. Reserve 10-15 minutes each week to read through 10-20 random conversations, including a mix of high-satisfaction and low-satisfaction sessions. This practice keeps you connected to the real user experience and often reveals issues that aggregate metrics miss — awkward phrasing, confusing button labels, or knowledge base gaps that affect only a small percentage of users but significantly degrade their experience.
Chatbot analytics is not a passive observation exercise. Every metric in this guide is a lever you can pull to improve performance. The organizations that achieve the best chatbot ROI are not those with the most sophisticated technology — they are those with the most disciplined measurement and improvement practices. Start with the 15 metrics in this framework, build the dashboard, establish the weekly cadence, and your chatbot will continuously earn more value for your business week over week.
Was this article helpful?
Chatbot Analytics FAQ
Everything you need to know about chatbots for chatbot analytics.
About the Author

Conferbot Team specializes in conversational AI, chatbot strategy, and customer engagement automation. With deep expertise in building AI-powered chatbots, they help businesses deliver exceptional customer experiences across every channel.
View all articles