
Real Estate Market Trends Analyzer
Free Real Estate Chatbot Template
A complete real estate market trends analyzer chatbot template — deploy in minutes to automate conversations, capture leads, and provide 24/7 assistance.



What Is a Real Estate Market Trends Analyzer Chatbot?
A real estate market trends analyzer chatbot is a conversational AI tool that delivers neighborhood-level market intelligence to buyers, sellers, and investors through an interactive, on-demand conversation. Instead of requiring users to navigate complex dashboards, download reports, or interpret raw MLS data, the chatbot answers market questions in plain language: "What are homes selling for in Oakwood Heights?" "Is now a good time to sell my condo in downtown Denver?" "What is the rental yield for a duplex in the 78704 ZIP code?" The chatbot retrieves, analyzes, and presents market data conversationally — making every website visitor feel like they have a personal market analyst on call.
The Market Intelligence Gap in 2026
Real estate consumers are more data-hungry than ever, but the data they find is often overwhelming, outdated, or too broad to be actionable. National headlines report "home prices rose 4.2% year-over-year," but a buyer considering a specific neighborhood needs to know that three-bedroom homes in that ZIP code have appreciated 8.1% while condos have declined 2.3%. According to the National Association of Realtors, 97% of homebuyers use the internet during their search, and 52% say that understanding local market conditions is the most important factor in choosing an agent. The gap between the data consumers want and the data they can actually access creates a massive opportunity for agents who can bridge it.
A market trends analyzer chatbot bridges this gap by transforming raw market data into personalized, neighborhood-level insights delivered in a conversational format. It answers the specific questions that drive buying and selling decisions — not "what is the national average?" but "how has the median price in my target neighborhood changed over the last 12 months, and what does that mean for my offer strategy?" This precision transforms the chatbot from a novelty into a decision-support tool that buyers and sellers genuinely rely on.
Static Market Reports vs. Conversational Intelligence
Most real estate websites offer some form of market data — usually a monthly market report PDF or a generic neighborhood page with aggregate statistics. The problem is accessibility. A 15-page market report contains valuable data, but fewer than 8% of website visitors download it, and fewer than 3% read it thoroughly. A chatbot delivers the same insights in bite-sized, relevant responses to specific questions — and it does so in the context of the user's actual situation, not as a one-size-fits-all report. Build this experience using Conferbot's AI chatbot builder and connect it to your preferred market data sources for real-time accuracy.
Who Benefits Most
This template is built for real estate agents and teams who want to establish market authority, property listing platforms that want to increase engagement, real estate investment firms that need to deliver portfolio-level analytics to clients, and mortgage lenders who want to provide context around property values and market timing. Any organization that competes on local market knowledge can deploy the market trends analyzer chatbot to deliver that knowledge at scale.
How the Market Trends Analyzer Chatbot Works
The market trends analyzer chatbot combines a natural language understanding engine with a real estate data layer that retrieves, processes, and presents market intelligence in real time. Users can ask freeform questions or follow guided conversation paths — either way, the chatbot delivers specific, data-backed answers with visual context and clear next steps.
Core Conversation Flow
| Step | Chatbot Action | User Input | Data Retrieved |
|---|---|---|---|
| 1. Location identification | "Which neighborhood, ZIP code, or city would you like market data for?" | Enters location (e.g., "78704" or "Oakwood Heights") | Geocodes location, identifies MLS market area |
| 2. Interest type | "Are you looking to buy, sell, invest, or just researching the market?" | Selects intent | Configures analysis lens (buyer metrics vs. seller metrics vs. investor metrics) |
| 3. Property type | "What property type — single-family homes, condos, townhouses, or multi-family?" | Selects property type | Filters data to matching property type |
| 4. Market snapshot | Delivers current median price, inventory level, days on market, price per square foot, and 12-month trend | Reviews data | Aggregates MLS data for specified filters |
| 5. Deep dive | "Want to see comparable sales, price predictions, or investment analysis for this area?" | Selects analysis type | Runs selected analysis module |
| 6. Comparable sales | Shows 5-8 recent comparable sales with price, size, days on market, and sale-to-list ratio | Reviews comparables | Retrieves MLS closed sale records |
| 7. Personalized insight | "Based on this data, here is what it means for your situation..." | Engages with recommendation | Generates contextual recommendation based on intent + data |
| 8. Lead capture | "Want a monthly update on this market or to connect with a local expert?" | Provides contact info or schedules call | Creates lead record with full market interest profile |
Data Architecture
The chatbot's data layer pulls from multiple sources to deliver comprehensive market intelligence. At the core is MLS data — closed sales, active listings, pending sales, and expired listings — which provides the most granular and current view of local market conditions. This is supplemented by public record data (assessment values, ownership transfers, deed records), census and demographic data (population growth, income levels, household composition), and economic indicators (employment rates, building permits, mortgage rate trends). The multi-source approach ensures that the chatbot can answer not just "what is happening" but "why it is happening" — providing context that differentiates expert analysis from raw data.
Natural Language Query Engine
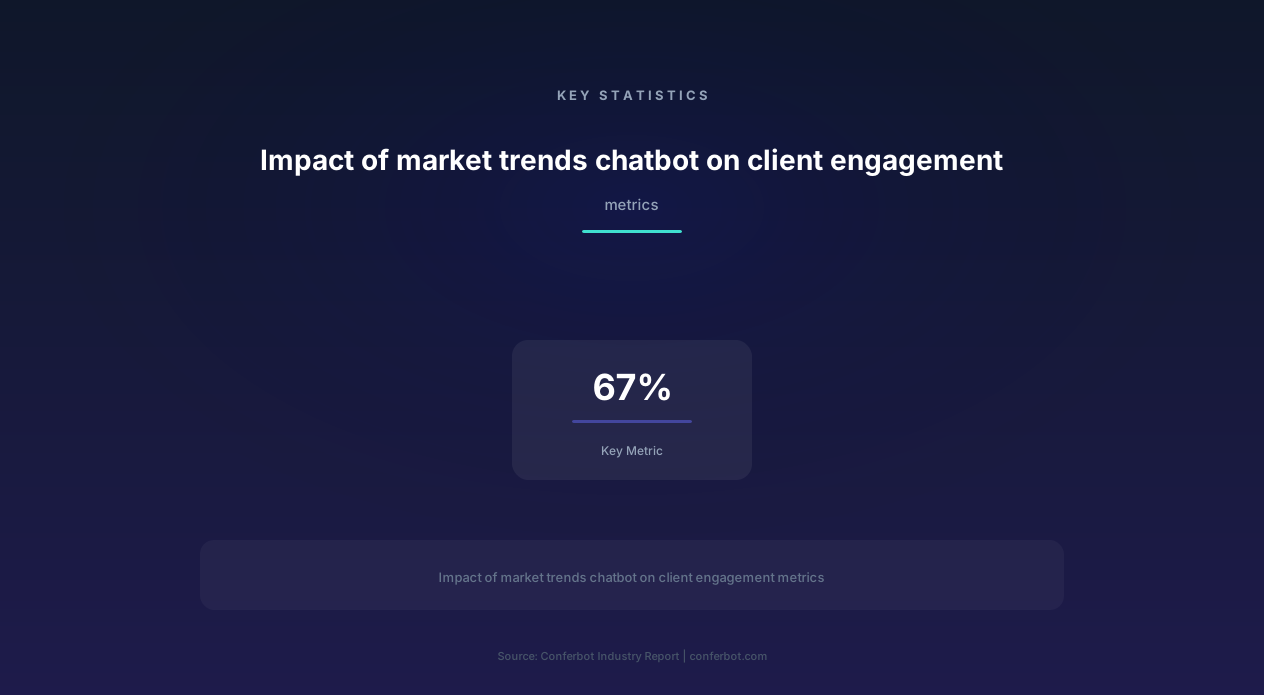
Unlike structured search tools that require users to fill in specific fields, the chatbot understands natural language queries. A user can ask "How much are 3-bedroom homes going for near Riverside Park?" and the chatbot parses the intent (pricing data), the property type (3-bedroom homes), and the location (Riverside Park area) — then delivers a targeted response. This natural interaction model means that users do not need to know which data to ask for; they describe what they want to know, and the chatbot figures out how to answer. This accessibility is what drives the 67% engagement increase that agents report after deploying the chatbot — users who would never navigate a data dashboard will readily ask a chatbot a question. Connect the full natural language engine through Conferbot's API integration for seamless data retrieval from your preferred market data providers.
Key Features of the Market Trends Analyzer Chatbot
The market trends analyzer chatbot is designed to deliver the full spectrum of market intelligence that buyers, sellers, and investors need to make informed real estate decisions. Each feature is built to serve a specific analytical need while simultaneously generating engagement data and lead qualification signals for the deploying real estate professional.
Complete Feature Matrix
| Feature | Description | Operational Benefit | Customer Benefit |
|---|---|---|---|
| Neighborhood trend analysis | 12-month and 5-year trends for median price, inventory, days on market, and price per sqft at the ZIP code and neighborhood level | Demonstrates deep local market expertise to potential clients | Understands whether a neighborhood is appreciating, stable, or declining |
| Price prediction modeling | 6-month and 12-month price forecasts based on historical trends, seasonality, inventory dynamics, and macroeconomic factors | Positions agents as forward-looking advisors, not just data reporters | Makes better timing decisions for buying and selling |
| Comparable sales analysis | 5-8 recently closed comparable sales with detailed metrics: price, price/sqft, days on market, sale-to-list ratio, and property photos | Pre-educates buyers and sellers on realistic pricing before consultation | Forms data-backed expectations for offers and listing prices |
| Investment potential scoring | Scores neighborhoods 1-100 based on appreciation rate, rental demand, cap rate, price-to-rent ratio, and economic growth indicators | Attracts investor clients and generates high-value leads | Quickly compares investment potential across multiple areas |
| Market timing advisor | Analyzes current market phase (buyer's market, seller's market, balanced) with seasonal adjustment and recommends optimal timing | Drives urgency for listings and offers based on data, not pressure | Understands when market conditions favor their position |
| Rental yield calculator | Calculates gross and net rental yield, cap rate, cash-on-cash return, and monthly cash flow for investment properties | Generates warm leads for investment property sales and property management | Makes informed investment decisions with real return projections |
| School district correlation | Shows relationship between school ratings and property values in the target area with premium analysis | Addresses a top buyer concern proactively with data | Understands the value premium associated with higher-rated schools |
| Supply and demand indicators | Months of inventory, new listing pace, absorption rate, and active-to-pending ratio for the target market | Provides leading indicators for future price movement | Gauges competition level before entering the market |
| Price reduction tracking | Tracks percentage of active listings with price reductions, average reduction amount, and days before reduction | Identifies weakening markets early for proactive client communication | Knows whether sellers are motivated and reductions are common |
| Comparative market heat map | Visual comparison of adjacent neighborhoods by price, appreciation, and demand metrics | Expands buyer search area to neighborhoods they had not considered | Discovers adjacent areas that offer better value or stronger appreciation |
Comparable Sales Intelligence
The comparable sales feature goes beyond listing recent sales. The chatbot selects comparables using a weighted algorithm that considers proximity, property size, age, condition, and sale recency — the same methodology used by professional appraisers. For each comparable, the chatbot presents the sale price, price per square foot, days on market, sale-to-list ratio (which indicates whether the seller got above or below asking), and a brief property description. The user can ask follow-up questions about any comparable: "Why did that one sell for less?" prompts the chatbot to identify distinguishing factors like smaller lot size, older construction, or a longer time on market.
This comparable intelligence is particularly powerful for listing presentations. An agent who can show a seller 5-8 precisely selected comparables during a pre-listing consultation — data that the seller can independently verify through the chatbot — establishes credibility and justifies the recommended listing price. Deploy comparable analysis across your website chatbot and share results via WhatsApp for mobile-first client communication.
Ready to try Real Estate Market Trends Analyzer?
Deploy this template in under 10 minutes. No coding required.
Use This Template Free →Benefits and ROI for Real Estate Professionals
Deploying a market trends analyzer chatbot transforms how real estate professionals attract, engage, and convert clients. The ROI extends beyond direct lead generation to encompass brand positioning, client retention, and operational efficiency. Here is a detailed breakdown of the measurable impact across key business metrics.
Before and After: Impact on Key Metrics
| Metric | Before Chatbot | After Chatbot | Improvement |
|---|---|---|---|
| Website engagement time | 2.1 minutes average | 6.8 minutes average | +223.8% |
| Market report download rate | 7.8% | 34.2% (chatbot equivalent) | +338.5% |
| Lead capture rate from market content | 4.2% | 19.6% | +366.7% |
| Listing presentation win rate | 38% | 54% | +42.1% |
| Client satisfaction (market knowledge) | 3.6 / 5 | 4.7 / 5 | +30.6% |
| Time spent preparing CMAs per client | 45 minutes | 12 minutes | -73.3% |
| Investor lead generation per month | 8 | 34 | +325% |
| Repeat visitor rate (market data users) | 12% | 41% | +241.7% |
Market Authority Positioning
In real estate, perceived expertise drives client acquisition. The 2026 NAR Profile of Home Buyers and Sellers reports that 73% of sellers interview only one agent before listing — and they choose that agent based on perceived local market knowledge. A market trends analyzer chatbot on your website signals to every visitor that you have deep, data-driven expertise in the local market. When a potential seller asks the chatbot "What are homes like mine selling for in Willow Creek?" and receives a detailed, data-backed response with 5 comparable sales and a 6-month forecast, that seller is far more likely to schedule a listing consultation with you than with an agent whose website offers a generic "Request a free CMA" form.
Investor Client Acquisition
Investor clients are among the most valuable in real estate — they transact frequently, refer other investors, and generate management fees when properties are leased. But investors are also the most data-demanding clients. They will not engage with an agent who cannot discuss cap rates, cash-on-cash returns, and appreciation trends with fluency. The market trends chatbot attracts investor clients by delivering the exact analytics they need: rental yield calculations, investment potential scores, and comparative market data across neighborhoods. Investors who use the chatbot to screen potential markets are pre-qualified by the time they contact an agent — they have identified their target areas, understand the return profiles, and are ready to view properties.
Operational Efficiency
The market trends chatbot reduces the time agents spend on repetitive market research tasks. Instead of manually pulling comparable sales and building CMA presentations for every prospect, agents can direct clients to the chatbot for self-service market exploration. The chatbot delivers the same data the agent would manually compile — but in 2 minutes instead of 45. When the client does schedule a consultation, they arrive already informed about current market conditions, so the meeting focuses on strategy rather than education. Pair the chatbot with Conferbot's calendar integration to let informed prospects book consultations directly from the market analysis conversation.
Price Prediction and Investment Analysis Capabilities
Two of the most high-value and differentiated capabilities of the market trends analyzer chatbot are its price prediction modeling and investment analysis tools. These features go beyond reporting historical data to deliver forward-looking insights that directly inform buying, selling, and investment decisions. This section details the methodology and practical application of each capability.
Price Prediction Methodology
The chatbot's price prediction model generates 6-month and 12-month forecasts for median home prices at the ZIP code level. The model considers multiple input variables:
- Historical price trajectory: The 3-year, 5-year, and 10-year trend lines for the target market, weighted toward more recent data to capture current momentum.
- Inventory dynamics: Current months of inventory relative to historical norms. Markets with less than 3 months of inventory tend to see continued price appreciation; markets above 6 months tend to see softening.
- Absorption rate trends: The rate at which available homes are being sold relative to new listings entering the market. Accelerating absorption signals strengthening demand.
- Mortgage rate impact: Current and projected mortgage rates and their effect on buyer purchasing power. A 1% rate increase reduces buying power by approximately 10%, which can dampen price growth in rate-sensitive markets.
- Seasonal adjustment: Real estate markets have predictable seasonal patterns. The model adjusts forecasts to account for spring market acceleration, summer plateaus, and winter slowdowns specific to each market.
- Economic indicators: Local employment growth, population migration data, and building permit activity provide leading indicators of future housing demand.
The chatbot presents forecasts with confidence intervals: "Based on current trends, the median price for single-family homes in 78704 is projected to reach $585,000-$615,000 within 12 months, representing a 4.2-7.6% increase from the current $562,000 median. This forecast has medium-high confidence based on strong absorption rates and below-average inventory." This transparent approach builds trust by showing the user both the prediction and the basis for it.
Rental Yield and Investment Analysis
For investor-focused conversations, the chatbot calculates detailed investment metrics for any target property or market area:
- Gross rental yield: Annual rental income divided by property value. The chatbot retrieves median rent data for the property type and location to estimate annual rental income.
- Net rental yield: After accounting for estimated expenses including property taxes, insurance, maintenance (typically 1% of value annually), vacancy (5-8%), and property management fees (8-10%).
- Cap rate: Net operating income divided by property value — the standard measure for comparing investment properties across markets.
- Cash-on-cash return: Annual pre-tax cash flow divided by total cash invested, accounting for financing. The chatbot factors in the user's down payment, interest rate, and loan terms to calculate the actual return on cash invested.
- Price-to-rent ratio: Property price divided by annual rent. Ratios below 15 generally favor buying; ratios above 20 generally favor renting — this metric helps investors identify markets where purchase prices are attractive relative to rental income.
An investor asking "What is the rental yield for a duplex in East Austin?" receives a complete analysis: "Based on current market data, a median-priced duplex in East Austin ($485,000) with estimated monthly rent of $2,850 per unit generates a gross yield of 7.05% and estimated net yield of 4.8% after expenses. At 25% down with a 6.75% rate, your cash-on-cash return would be approximately 8.2%." This level of specificity attracts serious investors and generates high-value leads. Connect investment analysis tools through Conferbot's API integration for real-time rental data from sources like Zillow Rental Manager and Rentometer.
Implementation Guide: Setting Up Your Market Trends Chatbot
Deploying the market trends analyzer chatbot requires connecting it to reliable market data sources and configuring the analysis modules for your specific market areas. This guide walks through the complete setup process from template activation to production deployment.
Phase 1: Template and Branding Setup (30 Minutes)
Load the Market Trends Analyzer template from Conferbot's library and customize it for your brand:
- Welcome message: Position your brand as the local market authority: "Welcome to [Your Brand]'s market intelligence assistant. I can provide real-time neighborhood trends, price forecasts, comparable sales, and investment analysis for any area in [Your Market]. What would you like to know?"
- Brand elements: Upload your logo, set brand colors, and configure the chatbot widget position on your website.
- Conversation tone: For market analysis, we recommend a confident, data-driven tone that conveys expertise: factual, specific, and backed by numbers.
- Market area definition: Define the geographic boundaries of your market coverage — the ZIP codes, cities, and neighborhoods the chatbot will serve.
Phase 2: Data Source Configuration (2-4 Hours)
The chatbot's value is entirely dependent on the quality and freshness of its data. Configure at least one primary data source and supplement with additional sources as available:
- MLS data feed: The most granular and current source. Connect via RETS/RESO Web API or through your MLS's data distribution program. This provides active listings, pending sales, closed sales, expired listings, and listing history — the foundation for all market analysis.
- Public records data: Assessment values, ownership transfers, and deed records from county recorder offices. Available through providers like ATTOM, CoreLogic, or direct county API connections.
- Rental data: For investment analysis features, connect to rental listing aggregators (Zillow Rental Manager, Apartments.com API, Rentometer) to retrieve current rental rates by property type and location.
- Economic data: Bureau of Labor Statistics employment data, Census population estimates, and building permit data provide the macroeconomic context for price prediction models.
Phase 3: Analysis Module Configuration (1-2 Hours)
Configure each analysis module for your market's characteristics:
- Comparable selection criteria: Set the default search radius (0.25-1.0 miles), property age tolerance (±10 years), size tolerance (±20%), and lookback period (3-12 months) for comparable sales analysis. Adjust these parameters based on market density — dense urban markets use tighter criteria, while rural markets require wider parameters.
- Price prediction calibration: Run the prediction model against historical data for your market to calibrate accuracy. Adjust the weighting of input variables based on which factors most strongly predict price movement in your specific market.
- Investment thresholds: Configure the benchmarks used for investment scoring — cap rate targets, minimum cash-on-cash return expectations, and appreciation rate thresholds that reflect your market's investor expectations.
Phase 4: Integration and Testing (1-2 Hours)
Connect the chatbot to your CRM (Salesforce, HubSpot, Follow Up Boss) so that every market analysis interaction creates or enriches a contact record with the user's market interests, property type preferences, and investment criteria. Test the chatbot with at least 20 real queries across different analysis types and neighborhoods to verify data accuracy and conversation quality. Deploy on your website and share via WhatsApp for maximum reach.
50,000+ businesses use Conferbot templates to automate conversations
Use Cases Across Real Estate Business Models
The market trends analyzer chatbot serves diverse real estate business models, each leveraging the analytics engine differently. Here are the primary use cases with specific implementation examples and measured outcomes.
Use Case 1: Listing Presentation Support
Before a listing appointment, agents share a chatbot link with the potential seller: "Before we meet, try our market analyzer — enter your address and see what comparable homes have sold for recently." The seller arrives at the meeting already informed about current market conditions, having seen 5-8 comparables and a price trend analysis. This pre-education eliminates the common objection "I think my home is worth more" because the seller has independently verified the data. Agents report a 42% increase in listing presentation win rates and a 28% reduction in days-to-list-price-agreement when sellers use the chatbot before the initial consultation.
Use Case 2: Buyer Market Education
Buyers who relocate from other markets often have unrealistic expectations about pricing, competition, and market pace. The chatbot educates relocation buyers before they arrive: "The median price for 4-bedroom homes in your target area is $520,000, homes receive an average of 3.2 offers, and the typical sale closes at 102% of asking price. The market favors sellers, so competitive offer strategies are important." This education reduces buyer frustration, accelerates the search process, and positions the agent as a knowledgeable guide rather than someone who just unlocks doors.
Use Case 3: Investment Property Lead Generation
Real estate investment firms deploy the chatbot to attract and qualify potential investors. By offering free rental yield analysis and investment potential scoring, the chatbot attracts data-savvy investors who are actively evaluating markets. The chatbot qualifies investors based on their target return thresholds, investment budget, and property type preferences — delivering pre-qualified leads to the investment team with a complete investor profile. Investment firms report generating 325% more qualified investor leads per month after deploying the chatbot.
Use Case 4: Monthly Market Update Engagement
Instead of sending static PDF market reports that few clients read, agents send a monthly chatbot link: "Your monthly market update is ready — ask me anything about what changed in your neighborhood this month." Clients engage with the data conversationally, asking questions specific to their situation rather than scanning a generic report for relevant information. This interactive approach increases market report engagement from 8% (PDF download) to 34% (chatbot conversation) and generates re-engagement opportunities as clients ask follow-up questions that reveal their current real estate intentions.
Use Case 5: Developer Feasibility Analysis
Real estate developers use the chatbot to screen potential development sites by analyzing market demand in target neighborhoods. The chatbot provides absorption rate data (how quickly units sell), pricing trends by unit type, competitive supply analysis (how many similar projects are planned or under construction), and demographic demand indicators. Developers who use the chatbot for initial market screening report saving 15-20 hours per potential project in preliminary research, allowing them to evaluate more opportunities and identify the most promising sites faster.
Use Case 6: Lender Pre-Qualification Enhancement
Mortgage lenders embed the market trends chatbot alongside their pre-qualification tools to provide borrowers with market context. A borrower who has been pre-approved for $475,000 can immediately ask the chatbot which neighborhoods fit their budget, how prices are trending in those areas, and whether they should act quickly based on inventory levels. This market context increases borrower confidence and accelerates the transition from pre-approval to active property search — benefiting both the lender (faster loan origination) and the referring real estate agent (a motivated, informed buyer).
Analytics, Engagement Tracking, and Continuous Optimization
The market trends analyzer chatbot generates valuable data about user market interests, search patterns, and engagement behavior. This data informs both chatbot optimization and broader business strategy. Here is how to leverage analytics for continuous improvement and competitive advantage.
Engagement Analytics Dashboard
Conferbot's built-in analytics track every interaction with the market trends chatbot, providing insights into user behavior and content effectiveness:
- Most queried neighborhoods: Identify which areas generate the most market analysis requests. High-query neighborhoods represent concentrated demand — focus your marketing, content creation, and listing acquisition efforts there.
- Query type distribution: Understand whether users primarily seek pricing data, comparable sales, investment analysis, or timing advice. This reveals your audience composition (buyers vs. sellers vs. investors) and helps you tailor the chatbot's opening message and proactive prompts accordingly.
- Conversation depth: Track how many analysis modules users explore per session. Users who engage with 3+ modules (e.g., market snapshot + comparables + price prediction) are significantly more likely to convert to leads than single-module users.
- Follow-up question patterns: Analyze the most common follow-up questions to identify knowledge gaps in the chatbot's responses. If 30% of users ask "But what about school ratings?" after receiving a neighborhood analysis, add school data to the default response.
- Lead conversion by entry point: Measure which pages and channels generate the highest-quality leads. Market analysis chatbots embedded on listing detail pages typically convert at 2-3x the rate of chatbots on the homepage because users have already expressed specific property interest.
Market Intelligence from User Behavior
Aggregate chatbot data provides leading indicators of market trends before they appear in traditional reporting. When chatbot queries for a specific neighborhood spike 40% month-over-month, that area is generating increased buyer interest — potentially signaling upcoming price appreciation. When investment analysis queries shift from one submarket to another, investor capital is moving, which predicts future transaction volume. When the ratio of "Is now a good time to sell?" queries increases relative to "Is now a good time to buy?", seller sentiment is rising, which may precede an increase in new listings.
These behavioral signals give your team an information advantage that is not available through traditional market data sources. Use this intelligence to advise clients, time marketing campaigns, and prioritize listing acquisition in areas where demand is building. Export behavior data through Conferbot's analytics dashboard for integration with your business intelligence tools.
Continuous Improvement Protocol
Optimize the chatbot monthly using a structured review process: update data sources to ensure freshness, review conversation logs to identify unanswered questions, calibrate prediction models against actual market outcomes, and A/B test different conversation flows to maximize engagement and lead conversion. The chatbot should become more accurate and more valuable with each optimization cycle — building a data-driven moat that competitors with static market report PDFs cannot match. Track improvement metrics quarter-over-quarter to demonstrate the compounding value of ongoing optimization to stakeholders.
Real Estate Market Trends Analyzer FAQ
Everything you need to know about chatbots for real estate market trends analyzer.
Why Use a Template vs Building from Scratch?
Templates encode years of optimization data into the conversation flow before you start.
| Factor | Conferbot Template | Build from Scratch | Hire a Developer |
|---|---|---|---|
| Time to deploy | 10 minutes | 2-8 hours | 2-6 weeks |
| Cost | Free | Your time | $5,000-$25,000 |
| Day-1 conversion | 15-22% | 5-8% | 10-15% |
| Proven flows | Yes, data-tested | No | Depends |
| Updates included | Automatic | Manual | Paid |
| Multi-channel | 8+ channels | 1 channel | Extra cost |
| Analytics | Built-in | Must build | Extra cost |
Ready to Deploy Real Estate Market Trends Analyzer?
Join 50,000+ businesses. Free forever plan available. No credit card required.