
Improve Your Chatbot Conversion Rate Using Conversational Analytics
Using our conversational analytics dashboard, you can understand how customers are using your chatbot and use these insights to improve your performance in the future. The end result is more leads captured, more customer service tickets resolved and a better customer experience.
Data-Driven Chatbot Insights
Understand every conversation. Optimize every interaction. Grow your business with actionable analytics.
Monitor the metrics that matter
We've got conversational analytics down to a science. Our dashboard tracks all of the metrics that you need to make sense of your conversational data and pull actionable insights that lead to meaningful optimization.
Send conversational data where it needs to go
Chatbots work best when they integrate with the rest of your business. Our dashboard offers multiple ways to send your conversation data to your CRM, ERP or third-party analytics software, so that you can measure how your chatbot helps the rest of your business.
Export data for easy reporting
We get it. You need to submit reports and we might not have all the charts you need. Our dashboard let's you export conversation data as a csv, so that your team can pull the exact insights it needs.
Why Analytics Matters
You can't improve what you can't measure. Get complete visibility into your chatbot performance.
Conversation Metrics
Track total conversations, completion rates, drop-off points, and average session duration in real-time.
User Behavior Insights
Understand how users interact with your chatbot - most clicked buttons, common queries, and navigation paths.
Conversion Tracking
Measure lead captures, form completions, purchases, and other conversion goals tied to chatbot interactions.
Sentiment Analysis
AI-powered sentiment detection reveals user satisfaction levels and identifies areas for improvement.
Channel Breakdown
Compare performance across website, WhatsApp, Messenger, and other channels side-by-side.
Export & Integrate
Export data to CSV, connect to Google Analytics, or push metrics to your BI tools via API.
How it works 💁🏻♀️
Start tracking chatbot performance in minutes.
Create chatbot conversation workflow
Pick a pre-built chatbot template from 1000+ choices and make changes on it using our drag-n-drop builder.
Bring customers to your chatbot
Publish your chatbot either as a widget on your website, as a standalone page, or on WhatsApp
Sit & watch the data rolling in
View and analyze conversation data inside the Conferbot dashboard. Use 1000+ integrations to move data to your CRM/Database.
Analytics for Every Need
From daily monitoring to strategic planning - analytics that power smarter decisions.
Performance Monitoring
Real-time dashboards showing conversation volumes, response times, and satisfaction scores
Conversion Optimization
Identify drop-off points, A/B test conversation flows, and optimize for higher conversions
Team Performance
Track agent response times, resolution rates, and customer satisfaction per team member
Growth Tracking
Monitor chatbot adoption trends, user growth, and engagement metrics over time
Content Gap Analysis
Discover unanswered questions and missing content to improve your chatbot's knowledge base
Executive Reports
Automated weekly/monthly reports with key insights for stakeholders and leadership
Ready to Unlock Chatbot Insights?
Join thousands of businesses using analytics to optimize their chatbot performance. Start free, no credit card required.
Why Chatbot Analytics Matter More Than You Think
Deploying a chatbot without analytics is like running a marketing campaign without tracking results - you are flying blind. If you are new to bots, our guide to what a chatbot is explains the fundamentals these metrics measure. Chatbot analytics provide the data foundation for every optimization decision, from message wording to flow architecture to deployment strategy. Yet 40% of businesses with chatbots report checking performance data less than once a month, leaving massive improvement opportunities on the table.
The Business Case for Analytics
Teams that actively monitor and optimize based on chatbot analytics see dramatically different results:
- substantially higher conversion rates than set-and-forget deployments
- lower cost per conversation through continuous bot training
- faster identification of product/service issues (chatbot data as a feedback signal)
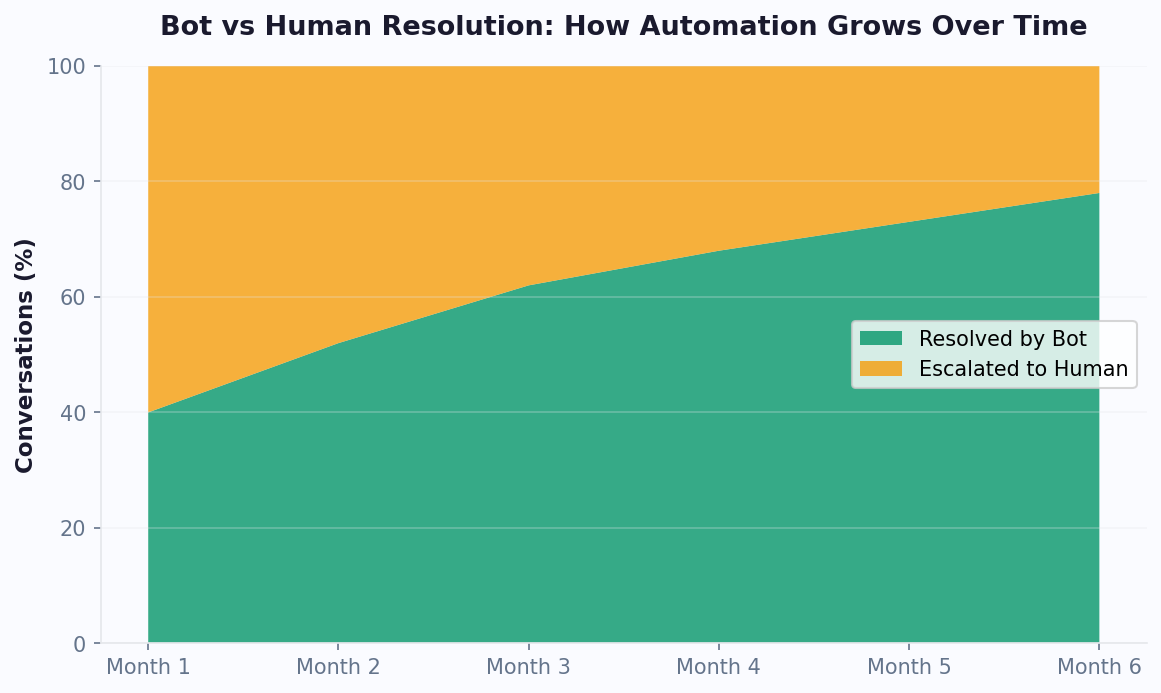
- a marked reduction in escalation rates within 90 days of analytics-driven optimization
Beyond direct chatbot performance, analytics serve as a real-time voice-of-customer channel. The questions users ask reveal their confusion points, unmet needs, and language preferences. Product teams can mine chatbot analytics for feature requests, marketing teams discover messaging that resonates, and support teams identify documentation gaps - all from the same dataset.
Modern chatbot analytics go far beyond basic "messages sent" counters. Conferbot's analytics suite tracks user journeys, conversion funnels, sentiment trends, resolution rates, and revenue attribution. It integrates with Google Analytics and CRM platforms via the integrations hub so chatbot performance data flows into your existing reporting stack. Whether you are optimizing a lead gen bot or a support assistant, analytics provide the evidence you need to make confident decisions. For a comprehensive strategy guide, see our customer support chatbot guide.
The 5 Key Chatbot Metrics (with Benchmarks)
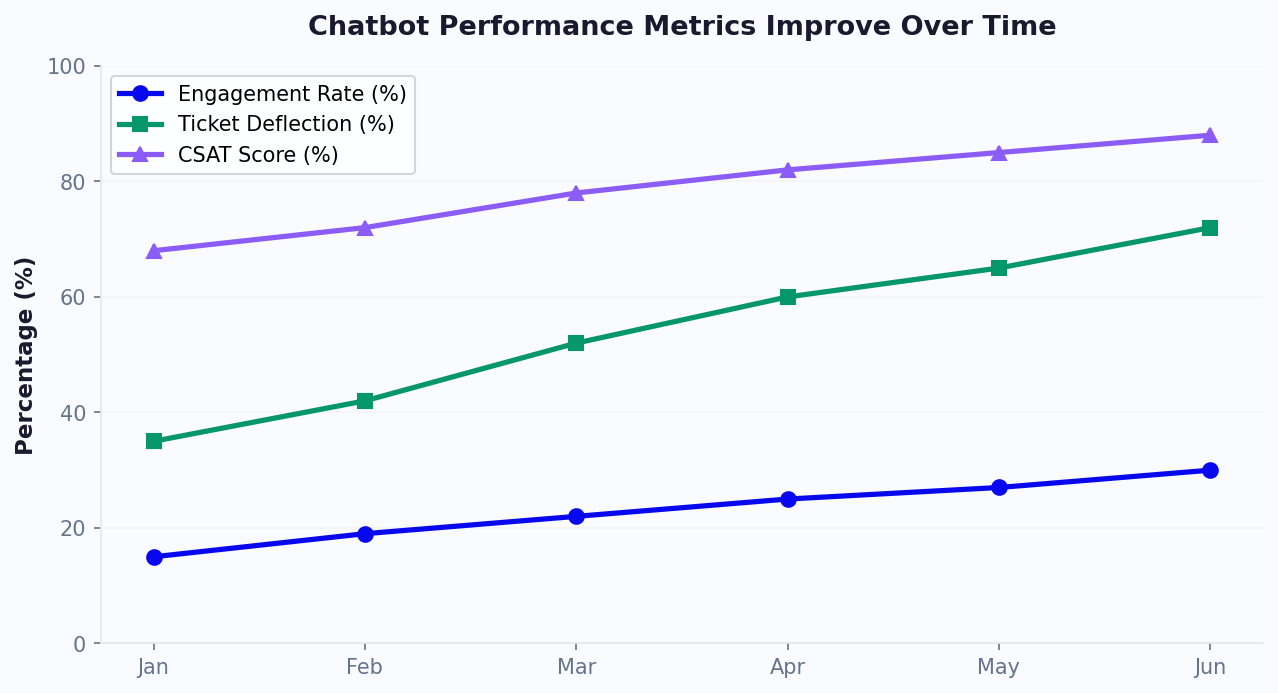
While chatbot analytics dashboards can display dozens of metrics, five key performance indicators (KPIs) provide the clearest picture of chatbot health and business impact. Track these daily and you will always know whether your bot is performing well or needs attention.
Essential Metrics with Industry Benchmarks
| Metric | Definition | Good | Great | Warning |
|---|---|---|---|---|
| Engagement Rate | % visitors who interact with bot | 3-5% | 8-15% | <2% |
| Completion Rate | % started conversations reaching end | 60-70% | 75-85% | <50% |
| Goal Conversion Rate | % conversations achieving business goal | 20-30% | 35-50% | <15% |
| Resolution Rate | % issues resolved without human help | 55-65% | 70-80% | <45% |
| CSAT Score | Post-conversation satisfaction (1-5) | 3.8-4.2 | 4.3-4.8 | <3.5 |
How to Interpret and Act on Each Metric
Low Engagement Rate: Your bot is not being noticed or is not compelling enough to interact with. Fix: adjust widget placement, add proactive triggers based on user behavior, improve the greeting message, or add a visual indicator.
Low Completion Rate: Users are starting but abandoning. Identify the specific drop-off point in your funnel analysis. Common causes: too many questions, confusing options, or a question that feels too personal too early.
Low Conversion Rate: Users complete the flow but do not take the desired action. This is usually a CTA problem - the offer is not compelling enough, the friction to convert is too high, or the timing is wrong.
Low Resolution Rate: The bot cannot answer common questions. Invest in your AI knowledge base by uploading more documents, adding FAQ entries, and reviewing unresolved conversations for training data.
Low CSAT: Users are dissatisfied. Review low-rated conversations individually. Common causes: robotic tone, incorrect answers, or inability to connect to live chat when needed.
Setting Up Your Analytics Dashboard
A well-configured analytics dashboard provides at-a-glance visibility into chatbot performance without requiring deep data analysis. The key is organizing metrics by stakeholder need - executives want ROI and volume, managers want efficiency and quality, and bot builders want funnel and drop-off data.
Dashboard Layout by Role
Executive Dashboard: Total conversations this month, cost per conversation, revenue attributed to chatbot, human escalation rate, and month-over-month trends. Keep it to 5-6 high-level numbers with trend arrows.
Manager Dashboard: Real-time active conversations, queue status, agent utilization, CSAT by channel, SLA compliance rate, and ticket volume forecast. This is the operational command center for daily decision-making.
Builder Dashboard: Funnel visualization showing drop-off at each conversation step, A/B test results, NLP confidence distribution, unrecognized intent log, and knowledge base gaps. This drives weekly bot optimization.
Configuring Conferbot Analytics
To set up your dashboard in Conferbot:
- Define goals: Navigate to Analytics > Goals and create conversion events (e.g., "demo booked," "lead captured," "issue resolved"). Goals are the foundation of meaningful reporting.
- Set up funnels: Map your conversation steps as funnel stages to visualize progression and drop-off.
- Configure alerts: Set thresholds that trigger notifications - e.g., alert when completion rate drops below 60% or when unresolved conversations exceed 30% in an hour.
- Schedule reports: Automate weekly email reports to stakeholders with key metrics and trends.
- Connect external tools: Push events to Google Analytics via the integrations hub for unified cross-channel attribution.
The most impactful dashboard element is the funnel visualization. When you can see that 92% of users complete step 1, 78% reach step 2, but only 45% pass step 3, you know exactly where to focus optimization effort. This single view has helped Conferbot customers improve conversion rates substantially within the first month of active monitoring. For detailed ROI tracking, use our chatbot ROI calculator alongside your analytics data.
The Continuous Optimization Loop
Elite chatbot teams do not optimize sporadically - they run a systematic optimization loop that produces compound improvements week over week. This framework ensures every chatbot in your portfolio improves continuously without requiring massive overhauls.
The Weekly Optimization Cycle
Monday - Review: Check the previous week's metrics against targets. Identify the single biggest underperforming metric. Pull conversation samples from that metric's cohort (e.g., if completion rate dropped, read 10 abandoned conversations to understand why).
Tuesday - Hypothesize: Based on your review, form a hypothesis about why the metric underperformed. "Users are abandoning at question 4 because the options don't match their situation" or "The greeting message is too generic to engage visitors on the pricing page."
Wednesday - Test: Implement an A/B test addressing your hypothesis. Change one variable: the message wording, the number of options, the question order, or the trigger condition. Use Conferbot's built-in A/B testing to split traffic between control and variant.
Thursday-Friday - Collect Data: Let the test run with sufficient volume. For statistical significance, you typically need 100+ conversations per variant. For high-traffic bots this happens in hours; for lower-traffic bots, extend the test period.
Following Monday - Evaluate: Analyze results. If the variant wins (typically requiring a 10%+ improvement to be meaningful), promote it to the default. If it loses or is inconclusive, revert and form a new hypothesis.
Compounding Effect
A 5% weekly improvement in one metric compounding over 12 weeks produces a 79% total improvement. This is why systematic optimization dramatically outperforms sporadic overhauls. Teams running this loop consistently report:
- substantial improvement in conversion rates within a few months
- a meaningful reduction in human escalation through progressive bot training
- higher user satisfaction from message refinement
The optimization loop works equally well for lead gen bots, support bots, and booking bots. The specific metrics differ, but the systematic approach of review, hypothesize, test, and implement applies universally. Track all experiments in your analytics dashboard to build institutional knowledge about what works for your audience.
A/B Testing Your Chatbot: What to Test and How
A/B testing is the most reliable method for improving chatbot performance because it eliminates guesswork. Instead of debating whether version A or B is better, you let real user behavior decide. Conferbot's built-in A/B testing splits incoming traffic between variants and reports statistical significance automatically.
What to A/B Test (Priority Order)
1. Greeting Message: The first message users see determines whether they engage. Test different lengths, tones, and value propositions. "Hi! How can I help?" vs. "Hi! I can help you find the right plan in 60 seconds - shall we start?" The specific version often makes a 20-40% difference in engagement rate.
2. Question Format: Open text vs. multiple choice vs. buttons. Generally, buttons and multiple choice have 30-50% higher completion rates than open text, but open text provides richer data. Test to find the right balance for your use case.
3. Flow Length: Test 4-question flows against 6-question flows. Shorter flows complete at higher rates but collect less data. Find the sweet spot where you get the information you need without losing users.
4. CTA Wording: "Book a demo" vs. "Get a free consultation" vs. "See pricing" - the end-of-conversation call to action directly impacts conversion. Small wording changes produce 15-25% differences.
5. Trigger Conditions: When does the bot appear? Test time-on-page (5s vs. 15s vs. 30s), scroll depth (25% vs. 50%), exit intent, or page-specific triggers. The right trigger can double engagement without changing anything in the bot itself.
Testing Best Practices
- Change one variable at a time. If you change the greeting AND the flow length simultaneously, you cannot attribute the result to either change.
- Run tests to significance. Minimum 200 conversations per variant for reliable results. For small effects, you may need 500+.
- Test duration: Run for at least 7 days to account for day-of-week effects. Weekday visitors may behave differently than weekend visitors.
- Document everything: Log your hypothesis, what you changed, the result, and the confidence level. This builds a knowledge base of what works for your audience.
For more on data-driven chatbot optimization, explore our building guide which includes a section on continuous improvement strategies.
Attribution & ROI: Proving Chatbot Business Value
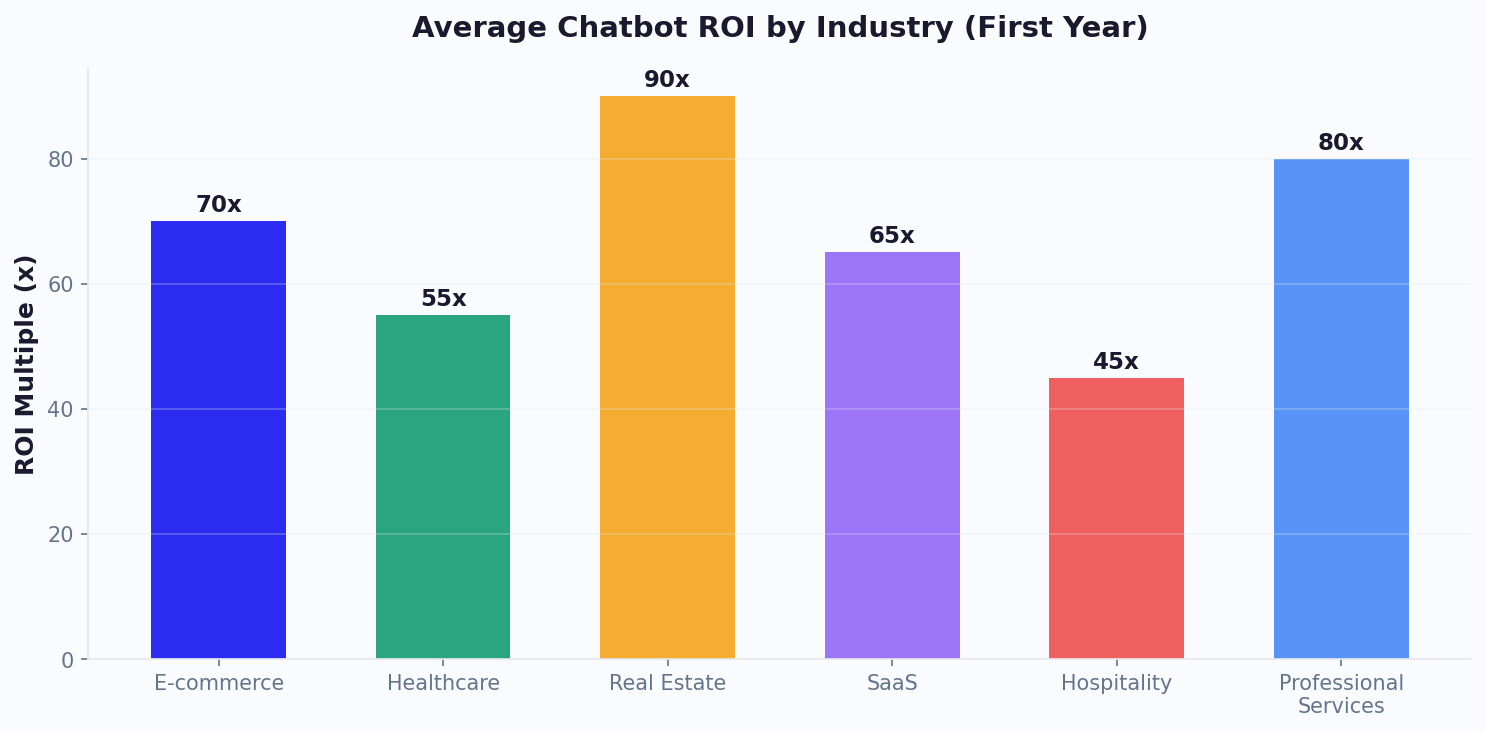
Stakeholders care about one question: "What is the chatbot actually doing for the business?" Attribution and ROI reporting translate chatbot metrics into business language - revenue generated, costs saved, and time reclaimed.
Attribution Models
Direct Attribution: Actions that happen within the chatbot conversation - form submissions, bookings made, purchases completed through the bot. This is straightforward to track and represents the bot's most measurable impact.
Assisted Attribution: Users who interact with the chatbot and later convert through another channel (e.g., chatted with bot Tuesday, signed up via email campaign Thursday). Conferbot tracks assisted conversions by associating user identifiers across sessions.
Deflection Attribution: Support conversations resolved by the bot that would otherwise require human agents. Calculate savings by multiplying deflected conversations by your average human chat cost ($5-$12).
Calculating True ROI
The chatbot ROI formula:
ROI = (Revenue Generated + Costs Saved - Platform Cost) / Platform Cost x 100
Example calculation for a mid-size business:
- Revenue from bot-generated leads: $15,000/month (30 qualified leads x $500 avg. deal value)
- Support cost savings: $8,000/month (1,600 deflected tickets x $5 per ticket)
- Platform cost: $59/month (Business plan)
- ROI: ($15,000 + $8,000 - $59) / $59 = 38,883% ROI
Even conservative calculations consistently show a strong ROI for well-optimized chatbots. The key is tracking both revenue generation (for sales/marketing bots) and cost avoidance (for support bots). Use our chatbot ROI calculator to model your specific scenario.
Reporting for Different Stakeholders
- CMO: Leads generated, conversion rate vs. forms, cost per lead from chatbot channel
- VP Support: Deflection rate, CSAT, cost per resolution, escalation trends
- CFO: Total ROI, cost savings trajectory, chatbot vs. headcount costs
- CEO: Customer satisfaction trend, revenue impact, competitive advantage
Compare your chatbot ROI against industry benchmarks on our comparison page and review pricing options to ensure you are on the optimal plan for your volume.
Common Analytics Mistakes That Lead to Bad Decisions
Misinterpreting chatbot analytics is often worse than not having analytics at all - it leads to confident but wrong decisions. Here are the most common analytics mistakes and how to avoid them.
Mistake 1: Vanity Metrics Obsession
"Our chatbot handled 50,000 messages this month!" Impressive, but meaningless without context. High volume with low resolution or low conversion is just noise. Focus on outcome metrics (conversions, resolutions, CSAT) not volume metrics (messages, sessions, interactions).
Mistake 2: Ignoring Statistical Significance
Drawing conclusions from small samples is the most common analytical error. "Version B had 40% higher conversion!" sounds great, but if it is based on 12 conversations, the result is random noise. Require minimum 200 conversations per variant before acting on A/B test results.
Mistake 3: Averaging Across Segments
An overall 65% completion rate might mask that desktop users complete at 80% while mobile users complete at 35%. Always segment analytics by device, channel, traffic source, and user type. The aggregate average hides the real story - and the real optimization opportunity.
Mistake 4: Not Tracking the Full Funnel
Measuring only in-bot metrics misses downstream impact. A chatbot lead might take 3 more weeks to close. If you only track the conversation, you miss the revenue it generated. Connect chatbot analytics to your CRM via the integrations hub for full-funnel attribution.
Mistake 5: Reacting to Single Data Points
One bad day does not make a trend. CSAT dropped Monday? Check if it was a system issue, a bad agent shift, or a random fluctuation before making changes. Always look at 7-day rolling averages for trend analysis.
Mistake 6: Not Comparing to Baseline
"Our chatbot converts at 25%." Is that good? Without knowing what the alternative (form, phone, email) converts at, you cannot judge. Always benchmark chatbot performance against the channel it replaced or supplements.
Mistake 7: Over-Optimizing for One Metric
Reducing the flow to 2 questions will boost completion rate but destroy data quality. Removing the satisfaction survey eliminates a metric to worry about but blinds you to problems. Optimize holistically using a balanced scorecard approach where no single metric dominates at the expense of others.
Learn from these pitfalls and build a data-driven culture around your chatbot operations. For deeper analytics strategies, explore our analytics feature page and the detailed metrics available in every Conferbot plan.
Advanced: Funnel Analysis and Conversation Intelligence
Funnel analysis is the most powerful tool in your analytics arsenal because it shows exactly where users disengage and why. Combined with conversation intelligence (reading the actual messages), it provides both quantitative and qualitative insight into chatbot performance.
Building Effective Funnels
A chatbot funnel maps each conversation step as a stage. For a lead qualification bot with 5 questions, your funnel might look like:
- Stage 1: Greeting seen → 100% (all visitors who trigger the bot)
- Stage 2: First response received → 72% (28% bounce at greeting)
- Stage 3: Question 2 answered → 65% (7% drop at Q1)
- Stage 4: Question 3 answered → 51% (14% drop at Q2 - investigate!)
- Stage 5: Contact info provided → 44% (7% drop at Q3)
- Stage 6: Goal completed → 38% (6% drop at final CTA)
The 14% drop at Stage 4 is your biggest opportunity. Read the conversations that ended at this point to understand why. Common patterns: the question was too personal ("What's your budget?"), too complex (too many options), or irrelevant to certain segments.
Conversation Intelligence Patterns
Unrecognized Intents: Review what users type when the bot fails to understand. These messages reveal capability gaps - topics your bot should handle but does not. Feed these back into your knowledge base training.
Sentiment Trends: Track positive vs. negative sentiment across conversations over time. A sudden shift often indicates a product issue, a messaging change that backfired, or an external event affecting user mood.
Path Analysis: For bots with multiple branches, analyze which paths are most common and which convert best. You may discover that an obscure branch (chosen by only 5% of users) converts at 80%, suggesting you should make it more prominent.
Predictive Analytics
Advanced analytics platforms (including Conferbot's Business tier) offer predictive capabilities:
- Churn prediction: Identify users likely to disengage based on early conversation signals
- Lead scoring: Predict conversion likelihood based on conversation patterns
- Volume forecasting: Predict tomorrow's conversation volume for staffing decisions
- Topic trending: Identify emerging topics before they become high-volume
These predictive models improve with data volume. Businesses processing 5,000+ conversations per month get the most value from predictive analytics. Compare feature availability across pricing plans to find the analytics depth you need.
Building Reports That Stakeholders Actually Read
The best analytics in the world are useless if stakeholders do not read the reports or act on the insights. Here is how to create reporting that drives action at every level of the organization.
The Three-Layer Reporting Framework
Layer 1: Automated Daily Digest (5 seconds to consume). A single-line Slack/email notification with the previous day's key numbers. Example: "Yesterday: 342 conversations | 68% completion | 24 leads captured | 91% CSAT." Any number that deviates more than 20% from average gets flagged. This keeps chatbot performance on everyone's radar without requiring dashboard visits.
Layer 2: Weekly Performance Summary (2 minutes to consume). A visual report with 5-7 key metrics, week-over-week trends, and one highlighted insight. Example: "Completion rate increased 8% after we simplified the budget question from open text to buttons. Recommend applying this pattern to the timeline question next." Include one chart and one action item.
Layer 3: Monthly Strategic Review (15 minutes to present). A comprehensive analysis for leadership meetings. Includes ROI calculation, trend analysis, A/B test results, competitive benchmarking, and strategic recommendations for the next month. Use this format for quarterly business reviews and budget discussions.
Tailoring Reports by Audience
| Stakeholder | Primary Metrics | Format | Frequency |
|---|---|---|---|
| CEO/Founder | ROI, revenue impact, customer satisfaction | Executive summary (1 page) | Monthly |
| Marketing VP | Leads, conversion rate, cost per lead | Dashboard + weekly email | Weekly |
| Support Manager | Deflection, CSAT, escalation rate, FCR | Real-time dashboard + daily digest | Daily |
| Bot Builder | Funnels, drop-off, NLP confidence, gaps | Interactive dashboard | Daily |
Conferbot's scheduled reports feature automates Layer 1 and Layer 2 reporting. Configure recipients, frequency, and included metrics in the Analytics settings. For Layer 3, export data to your preferred presentation tool using the CSV/PDF export or API access available on Pro and Business plans.
The ultimate goal of reporting is not information delivery - it is action generation. Every report should end with clear recommendations. "Completion rate is down 5% → Simplify question 3 → Expect recovery next week." Actionable insights beat beautiful dashboards every time. Track all improvements through Conferbot analytics for a complete optimization history.
Chatbot Analytics FAQ
Everything you need to know about implementing AI chatbots for chatbot analytics. Get answers about features, pricing, implementation, security, and industry-specific solutions.
Continue Exploring
Explore features, connect third-party tools, and browse ready-made templates.
Deep-dive pillar guides, real use cases, and the chatbot & AI glossary.