Why Email Surveys Get 10% Response Rates (and What That Costs You)
Customer feedback is the lifeblood of product decisions, retention strategy, and revenue growth. Yet the dominant method for collecting it -- email surveys -- is fundamentally broken. The numbers tell a stark story: the average email survey achieves a 10-15% response rate, according to SurveyMonkey's response rate research. That means 85-90% of your customers never share their opinions, and you make critical business decisions based on a thin, biased slice of your user base. (source: SurveyMonkey on survey response rates). (source: Harvard Business Review on customer feedback loops).
The Compounding Problem of Low Response Rates
Low response rates do not simply reduce sample size. They introduce systematic bias that actively distorts your understanding of customer sentiment. Research consistently shows that survey respondents are disproportionately drawn from two extremes: highly satisfied promoters who want to praise you, and deeply frustrated detractors who want to vent. The silent majority -- the passives, the mildly satisfied, the slightly annoyed -- never respond at all.
This creates a dangerous illusion. Your NPS score looks reasonable because the promoter-detractor ratio seems balanced, but the true distribution of sentiment across your entire customer base may tell a very different story. You might be sitting on a churn bomb and not know it because the customers most likely to leave silently are the ones least likely to fill out a survey. (source: Bain & Company NPS framework).
Why Customers Ignore Email Surveys
Understanding why email surveys fail requires examining the friction at every step of the process:
- Inbox competition: The average professional receives 121 emails per day. A survey request from your company competes with everything from urgent work tasks to personal messages. Survey emails are among the lowest-priority items in any inbox.
- Multi-step friction: The customer must open the email, read the request, click a link, wait for the survey page to load, parse the questions, select answers, optionally write comments, and submit. Each step is a drop-off point, and the cumulative abandonment rate is devastating.
- Timing disconnect: Email surveys typically arrive hours or days after the experience they reference. By that point, the emotional texture of the experience has faded. The customer cannot remember specific details, their motivation to respond has evaporated, and the feedback they would give -- if they gave any -- would be less accurate than what they would have said in the moment.
- Survey fatigue: The average consumer now receives 4-7 survey requests per week from various companies. This has created a learned behavior of ignoring survey emails entirely, regardless of the sender. Your carefully crafted feedback request is collateral damage in a world oversaturated with survey spam.
- No perceived value exchange: Filling out a survey takes 2-5 minutes and offers the customer nothing in return. There is no immediate resolution of their problem, no visible evidence that their feedback will lead to change, and no incentive beyond a vague sense of altruism.
The Business Cost of Feedback Gaps
When 85-90% of customers stay silent, the consequences ripple across every department:
| Business Function | Impact of Low Feedback Volume | Estimated Annual Cost |
|---|---|---|
| Product | Roadmap decisions based on vocal minority; real pain points remain invisible | $50K-$500K in misdirected development |
| Customer Success | Detractors churn silently without recovery opportunity | $100K-$1M in preventable churn |
| Marketing | Promoters never identified for referral or advocacy programs | $30K-$200K in missed referral revenue |
| Executive | NPS and CSAT scores statistically unreliable for strategic planning | Unquantifiable decision risk |
Companies spend $50,000-$200,000 annually on survey platforms like Qualtrics, SurveyMonkey, and Medallia, yet the data those platforms deliver is fundamentally compromised by the email delivery channel. The problem is not the survey tool. The problem is the medium. For a deeper look at how chatbots outperform traditional channels across multiple dimensions, see our chatbot vs email support comparison.

The solution requires a fundamentally different approach to feedback collection -- one that eliminates friction, meets customers in their existing context, and delivers value in both directions. That approach is conversational feedback through chatbots.
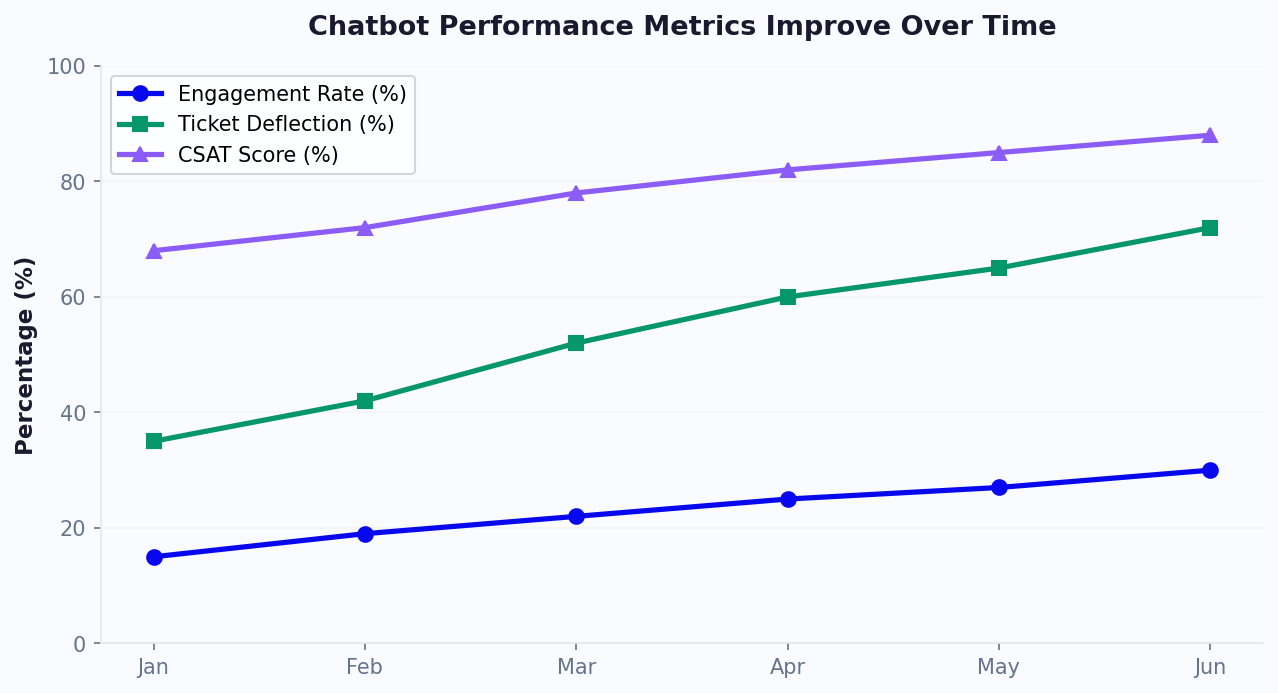
How Conversational Feedback Gets 4x More Responses
A conversational feedback chatbot replaces the email-link-form workflow with a natural, in-context dialogue that feels less like a corporate survey and more like a quick check-in. The result: 40-60% completion rates, which is 3-5x higher than email surveys. This is not a marginal improvement. It is a category change in feedback quality and volume.
Why Chatbot Surveys Outperform Every Other Channel
The performance gap between chatbot surveys and traditional methods comes down to five structural advantages:
1. Single-tap responses eliminate friction. In a chatbot survey, the customer taps a button to answer. There is no email to open, no page to load, no form to parse. The entire NPS interaction -- score plus follow-up -- takes 20-40 seconds. Compare that to the 2-5 minutes required for even a short email survey, and the response rate difference becomes obvious.
2. Contextual timing captures accurate sentiment. A chatbot asks for feedback at the exact moment of experience -- immediately after a support ticket is resolved, right after a purchase is completed, or during an active product session. Research from Qualtrics shows that feedback collected within 5 minutes of an experience is 3x more accurate than feedback collected 24 hours later. The chatbot makes real-time collection practical at scale.
3. Channel familiarity removes barriers. Customers are already inside the chat interface when the survey appears -- on your website widget, in WhatsApp, or within your app. They do not need to switch contexts, open a new tab, or navigate away from what they were doing. The survey is a natural extension of the conversation they are already having.
4. Conversational format feels human, not corporate. A chatbot saying "Quick question -- how was your experience today?" feels like a genuine check-in from a helpful assistant. An email titled "Customer Satisfaction Survey -- Your Feedback Matters" feels like a corporate obligation. The psychological difference drives response rates.
5. Immediate value exchange closes the loop. When a customer gives feedback through a chatbot, something happens right away. Detractors get offered help. Promoters get invited to share reviews or referrals. Passives get acknowledged and heard. This immediate response creates a positive feedback loop: customers learn that their input leads to action, which makes them more likely to respond next time.
Chatbot vs. Email Survey Performance: The Data
| Metric | Email Survey | Chatbot Survey | Improvement |
|---|---|---|---|
| Response rate | 10-15% | 40-60% | 3-5x |
| Completion rate (of those who start) | 55-70% | 82-92% | +25-30% |
| Follow-up comment rate | 20-35% | 55-75% | 2-3x |
| Time to complete | 2-5 minutes | 20-40 seconds | 5-8x faster |
| Time from experience to response | 6-48 hours | Under 5 minutes | Real-time accuracy |
| Detractor recovery rate | 5-10% (delayed) | 25-40% (real-time) | 3-5x |
| Cost per completed survey | $3-8 | $0.50-1.50 | 4-6x cheaper |

Real-World Response Rate Benchmarks
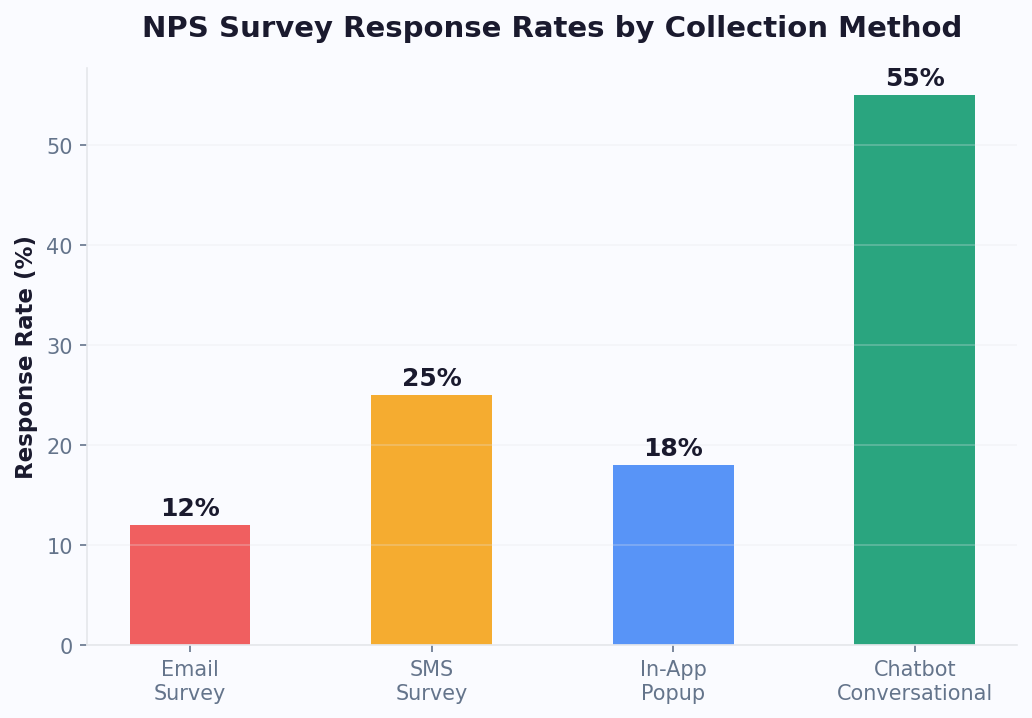
These are the response rates companies typically achieve when switching from email surveys to chatbot-based feedback collection:
- Post-support feedback: 55-65% response rate via chatbot (vs. 12-18% email)
- Post-purchase NPS: 40-55% via chatbot (vs. 8-14% email)
- In-app CSAT: 45-60% via chatbot (vs. 15-25% in-app pop-up)
- Quarterly relationship NPS: 35-50% via WhatsApp chatbot (vs. 10-15% email)
The higher response rates are not just about volume. They produce more representative data because you hear from the silent majority -- the passives and moderately satisfied customers who never bother with email surveys. This means your NPS, CSAT, and CES scores more accurately reflect your actual customer sentiment, enabling better decisions across product, support, and strategy. (source: Zendesk on CSAT benchmarks).
To start building your own conversational feedback system, explore Conferbot's no-code chatbot builder, which includes pre-built survey flow templates for NPS, CSAT, and CES.
Related: Chatbot Analytics: 10 Metrics You Must Track to Prove ROI in 2026
Designing an NPS Survey Flow in Your Chatbot: Step-by-Step
Net Promoter Score, developed by Bain & Company and Fred Reichheld, measures customer loyalty with a single question: "On a scale of 0-10, how likely are you to recommend us to a friend or colleague?" The genius of NPS is its simplicity, and a chatbot preserves that simplicity while adding contextual depth that email surveys cannot match.
The Core NPS Chatbot Flow
Here is the complete conversation flow, designed for maximum completion rate and actionable data:
Step 1: Permission-based opening (5 seconds)
Never ambush a customer with a survey question. Start with a brief, friendly opener that sets expectations and gives them an exit:
"Hi [Name]! Thanks for using [Product/Service]. Got 20 seconds for a quick question about your experience? It helps us improve."
Buttons: [Sure, go ahead] [Not right now]
If the customer declines, the chatbot responds gracefully: "No problem at all. If you ever want to share feedback, just type 'feedback' anytime. Have a great day!" Record the opt-out to prevent re-asking for at least 30 days.
Step 2: The NPS question (10 seconds)
"On a scale of 0 to 10, how likely are you to recommend [Company] to a friend or colleague?"
Display the scale as tappable buttons. Group them visually to reduce cognitive load:
- Row 1: [0] [1] [2] [3] [4] [5] [6] -- labeled "Not likely"
- Row 2: [7] [8] -- labeled "Neutral"
- Row 3: [9] [10] -- labeled "Very likely"
On channels that support color coding (website widget, some messaging platforms), use red for 0-6, yellow for 7-8, and green for 9-10. This visual cue helps customers calibrate their response.
Step 3: Conditional follow-up question (15-20 seconds)
This is where the chatbot flow diverges based on the score. Each segment gets a different follow-up that maximizes the value of the interaction:
For Promoters (9-10):
"That is wonderful to hear! What do you love most about your experience with us?"
Display category buttons for quick response: [Product quality] [Customer support] [Ease of use] [Value for money] [Other -- tell us more]
After their selection: "Thank you! Would you be willing to share that experience in a quick review? It takes 30 seconds and helps others like you discover us."
Buttons: [Leave a review] [Maybe later]
For Passives (7-8):
"Thanks for the feedback! We are close but clearly not quite there yet. What is the one thing we could improve to earn a 9 or 10 from you?"
Allow free-text response. The AI engine categorizes and tags the response automatically for product team review.
After their response: "That is really helpful. We take this seriously and will follow up. Is there anything else you would like us to know?"
For Detractors (0-6):
"We are sorry to hear that. Your experience matters to us, and we want to make it right. Can you tell us what went wrong?"
Offer both structured and free-form options: [Product issue] [Support experience] [Pricing concern] [Missing feature] [Something else -- tell us]
After their response: "Thank you for being honest with us. I would like to connect you with someone who can help resolve this right now. Would that be okay?"
Buttons: [Yes, connect me] [No, just wanted to share]
Step 4: Closing and next action (5 seconds)
End every flow path with a thank-you and clear next step:
- Promoters: Link to review platform or referral program
- Passives: Acknowledgment that feedback has been logged and will be reviewed
- Detractors: Live agent handoff or confirmation that a support ticket has been created
Flow Design Best Practices
- Keep the total flow under 60 seconds. The NPS question plus one follow-up should take 30-40 seconds. Optional free-text adds 15-20 seconds. If your flow takes longer than 60 seconds, you will see significant drop-off after the initial score.
- Use buttons for the primary question, free text for follow-ups. The 0-10 scale must be button-based. Follow-up questions can combine buttons (for quick categorization) with a free-text option (for detailed feedback).
- Personalize with customer data. Reference the specific interaction: "How was your experience with your recent order #4521?" is far more effective than a generic "How was your experience?" Pull order numbers, support ticket IDs, or product names from your CRM via Conferbot's integration hub.
- A/B test your opening message. The permission-based opener has the biggest impact on response rate. Test different tones (casual vs. professional), different value propositions ("help us improve" vs. "quick question"), and different formats (text vs. text with image) using Conferbot analytics.
NPS Calculation Refresher
For teams new to NPS, here is the methodology as defined by Bain & Company:
- Promoters (9-10): Loyal enthusiasts who will keep buying and refer others
- Passives (7-8): Satisfied but unenthusiastic; vulnerable to competitive offers
- Detractors (0-6): Unhappy customers who can damage your brand through negative word-of-mouth
NPS = % Promoters - % Detractors
The score ranges from -100 (every customer is a detractor) to +100 (every customer is a promoter). A score above 0 is generally positive, above 30 is good, and above 50 is excellent. Industry benchmarks vary significantly -- Qualtrics publishes annual NPS benchmarks by industry that are worth reviewing against your own scores.
Related: Chatbot for SaaS Onboarding: How to Reduce Churn in the First 7 Days (2026)
CSAT, CES, and NPS: Which Survey Type to Use and When
NPS is not the only feedback metric that matters. Depending on what you are trying to measure and when, you may need CSAT (Customer Satisfaction Score), CES (Customer Effort Score), or a combination of all three. Each metric answers a different question, and using the wrong one at the wrong moment produces misleading data. (source: Qualtrics on customer experience metrics).
The Three Core Feedback Metrics Compared
| Metric | Question Asked | Scale | What It Measures | Best Used After |
|---|---|---|---|---|
| NPS | "How likely are you to recommend us?" | 0-10 | Overall loyalty and brand advocacy | Relationship milestones, periodic check-ins |
| CSAT | "How satisfied were you with this interaction?" | 1-5 or 1-7 | Satisfaction with a specific interaction | Support tickets, purchases, specific touchpoints |
| CES | "How easy was it to accomplish your goal?" | 1-5 or 1-7 | Friction and effort in a process | Onboarding, self-service, complex workflows |
When to Use Each Metric in Your Chatbot
Use NPS when you want to measure the overall relationship. NPS is a lagging indicator of customer loyalty. It reflects the cumulative effect of every interaction the customer has had with your brand. Deploy NPS surveys at relationship milestones: after onboarding completion, at subscription renewal, or on a quarterly cadence. Do not use NPS to measure individual transactions -- it is too broad for that purpose.
Use CSAT when you want to measure a specific interaction. CSAT is a point-in-time metric. It tells you how the customer felt about the support chat they just had, the product they just received, or the feature they just used. Deploy CSAT surveys immediately after the interaction concludes. The chatbot is ideal for this because it can trigger the CSAT question the moment a support conversation ends or a transaction completes.
Use CES when you want to measure process friction. CES is the most underused of the three metrics, but it is arguably the most actionable. It measures how much effort the customer had to expend to achieve their goal. High effort correlates strongly with churn -- SurveyMonkey's research indicates that 96% of customers who report high-effort experiences become disloyal, compared to only 9% of those who report low effort. Deploy CES after self-service interactions, onboarding flows, returns and exchanges, or any multi-step process.
Building a Multi-Metric Feedback System
The most effective chatbot feedback systems use all three metrics at different touchpoints. Here is a recommended framework:
| Customer Journey Stage | Metric | Chatbot Trigger | Question |
|---|---|---|---|
| Post-support interaction | CSAT | Support ticket resolved | "How would you rate your support experience? 1 (Poor) to 5 (Excellent)" |
| Post-purchase | CSAT | Order delivered/confirmed | "How satisfied are you with your recent purchase?" |
| After onboarding | CES | Onboarding milestones hit | "How easy was it to get started with [Product]?" |
| After self-service | CES | Knowledge base article viewed | "Did you find what you were looking for?" |
| Quarterly check-in | NPS | 90-day interval from last NPS | "How likely are you to recommend us?" |
| Pre-renewal | NPS | 30 days before renewal | "How likely are you to recommend us?" |
| After feature launch | CSAT | Feature used for first time | "How satisfied are you with [new feature]?" |
| After returns/refunds | CES | Return process completed | "How easy was the return process?" |
Chatbot Flow Design for Each Metric
CSAT chatbot flow:
"How would you rate your experience with [specific interaction]?" Display 5 stars or a 1-5 scale as buttons. For scores below 3, ask: "What could we have done better?" For scores of 4-5: "Glad to hear it! Anything specific that stood out?"
CES chatbot flow:
"How easy was it to [accomplish task]?" Display a 1-5 scale from "Very difficult" to "Very easy" as labeled buttons. For scores of 1-2, offer immediate help: "That does not sound right. Would you like me to help you with that now, or connect you with a specialist?"
NPS chatbot flow:
Follow the detailed NPS flow design from the previous section. The key differentiator for NPS is the three-segment follow-up (promoter, passive, detractor) and the closed-loop actions that each segment triggers.

Combining Metrics Without Over-Surveying
A critical rule: never ask more than one metric per interaction. If a customer just completed a support conversation, ask CSAT (about that specific interaction), not NPS (about the overall relationship). If it is time for a quarterly NPS check-in, do not also ask CSAT about their last purchase.
Set up a global survey frequency controller in your chatbot platform. Conferbot's flow builder lets you define rules like:
- Maximum one survey of any type per customer per 30 days
- NPS no more than once per 90 days per customer
- CSAT/CES limited to the two most recent interactions per month
- If a customer opted out of one survey, suppress all surveys for 60 days
These guardrails prevent survey fatigue while still generating a continuous stream of feedback data across your customer base.
Related: Chatbot to Human Handoff: Setup Guide, Best Practices, and Message Templates
When to Trigger the Survey: Timing Best Practices
Timing is the single biggest lever for chatbot survey response rates. Ask at the wrong moment and your response rate drops by half. Ask at the right moment and you capture accurate, high-volume feedback that drives real improvement. The advantage of chatbot surveys over email is that you can trigger at precisely the right microsecond -- not whenever the email happens to be opened.
Trigger Event Reference Table
This table maps every common feedback trigger to its optimal timing, recommended metric, and expected response rate:
| Trigger Event | Optimal Timing | Metric | Expected Response Rate | Notes |
|---|---|---|---|---|
| Support ticket resolved | Immediately after resolution confirmation | CSAT | 55-65% | Highest response rates of any trigger; customer is still in the chat |
| Order delivered | 1-2 days post-delivery | CSAT | 40-50% | Allow time for the customer to use/inspect the product |
| Purchase completed | Immediately after checkout | CSAT | 45-55% | Measures the buying experience, not product satisfaction |
| Onboarding completed | After key activation milestone | CES + NPS | 40-55% | CES for setup difficulty, NPS for initial loyalty signal |
| Feature first use | After successful first use of new feature | CSAT | 35-45% | Captures feature-specific feedback for the product team |
| Subscription renewal | 7-14 days before renewal | NPS | 35-50% | Pre-renewal NPS identifies at-risk accounts in time to act |
| Return/refund processed | Immediately after completion | CES | 50-60% | High response rate because customer is emotionally invested |
| Self-service interaction | After knowledge base article viewed | CES | 30-40% | Simple "Did this help?" question with thumbs up/down |
| In-app session (3+ min) | During natural pause in activity | NPS | 25-35% | Lower rate but captures sentiment from active users |
| Quarterly relationship | Every 90 days, during business hours | NPS | 35-50% | WhatsApp outperforms email 3-4x for periodic surveys |
Timing Principles That Maximize Response Rates
Principle 1: Ask within the context window. The context window is the period during which the customer's experience is still fresh and they are still psychologically engaged with your brand. For transactional events (support, purchase), this window is minutes. For relationship events (quarterly NPS), the window is broader but still benefits from catching customers during active use periods.
Principle 2: Never interrupt a task in progress. Triggering a survey while a customer is in the middle of a checkout flow, support conversation, or product task will frustrate them and produce biased negative responses. Wait for a natural stopping point: after a task is completed, after a page loads, or during a clear transition between activities.
Principle 3: Match the channel to the trigger. Not every survey should fire in the same channel:
- In-app chat widget: Best for post-support, post-feature-use, and in-session feedback. The customer is already in your product.
- WhatsApp: Best for post-delivery, quarterly NPS, and any feedback where the customer has left your product. WhatsApp achieves the highest response rates (50-65%) for out-of-context surveys.
- Website chatbot: Best for post-purchase, post-browsing, and self-service feedback from visitors who are on your site but not logged in.
Principle 4: Respect time zones and business hours. For push-based surveys (WhatsApp, SMS), only send during the customer's local business hours (9am-6pm). Weekend surveys see 20-30% lower response rates than weekday surveys. Tuesday through Thursday are the highest-performing days for survey delivery.

Anti-Patterns: When NOT to Trigger Surveys
These triggers seem logical but consistently produce low response rates or biased data:
- During a support queue wait: The customer is already frustrated. Any survey at this point will measure their queue frustration, not their product sentiment.
- After a payment failure: The customer is dealing with a transactional problem. Do not layer a survey on top of that stress.
- Immediately after a price increase notification: Responses will overwhelmingly reflect price sensitivity, not genuine product satisfaction.
- On the same day as a major product incident: If your service had an outage, wait at least 72 hours before resuming surveys. Responses during or after an incident are not representative of normal sentiment.
- During onboarding before value delivery: Asking "How likely are you to recommend us?" before the customer has experienced your product's value produces meaningless data. Wait until after the activation milestone.
Setting Up Triggers in Conferbot
Use Conferbot's integration hub to connect survey triggers to your existing systems. Trigger events can be received from your CRM (HubSpot, Salesforce), help desk (Zendesk, Freshdesk, Intercom), e-commerce platform (Shopify, WooCommerce), or custom webhooks. Each trigger maps to a specific chatbot flow that fires automatically when the event occurs -- no manual intervention required.
Turning Detractors Into Conversations: Real-Time Recovery That Saves Revenue
Collecting a detractor score is not the finish line. It is the starting line. The most valuable thing a chatbot feedback system does is not measure sentiment -- it is act on sentiment in real time. A detractor who gives you a score of 3 and then gets an empathetic, immediate response has a 35-45% chance of being recovered. A detractor who fills out an email survey and hears nothing for a week has a 5-10% recovery rate. That difference represents tens or hundreds of thousands of dollars in prevented churn annually.
The Speed-to-Recovery Curve
Research consistently shows that the probability of recovering a detractor drops exponentially with time:
| Response Time After Detractor Feedback | Recovery Probability | Customer Sentiment After Recovery |
|---|---|---|
| Under 5 minutes (chatbot automated) | 40-50% | Often becomes promoter (service recovery paradox) |
| Under 1 hour (human follow-up) | 30-40% | Typically becomes passive or low promoter |
| 1-4 hours | 20-30% | May remain passive; unlikely to become promoter |
| 4-24 hours | 10-20% | Minimal sentiment improvement |
| 24+ hours | 5-10% | Customer has already formed fixed negative opinion |
The service recovery paradox is a well-documented phenomenon: customers who have a problem that gets resolved quickly and empathetically often become more loyal than customers who never had a problem at all. Your chatbot feedback system turns every detractor response into an opportunity to trigger this paradox.
The Three-Layer Detractor Recovery System
Layer 1: Immediate chatbot response (0-60 seconds)
The moment a customer submits a detractor score, the chatbot responds with empathy and offers immediate help. This is fully automated and works 24/7:
"We are genuinely sorry to hear about your experience. Your feedback is important, and we want to make this right. Can you tell me a bit more about what happened so I can connect you with the right person?"
Offer categorized options: [Product problem] [Support experience] [Billing issue] [Missing feature] [Delivery problem] [Other]
Based on their selection, the chatbot can attempt first-level resolution:
- Billing issue: "I can look into that right now. Can you describe the billing concern?" The chatbot checks for common issues (double charge, incorrect amount, unexpected renewal) and can initiate a refund or credit automatically for amounts under a configurable threshold.
- Product problem: "Let me help troubleshoot. What specifically is not working as expected?" The chatbot pulls from the AI knowledge base to offer solutions to known issues.
- Support experience: "I am sorry about that. Would you like to be connected with a senior support specialist right now?" Route to live chat with priority queuing.
Layer 2: Human escalation (1-60 minutes)
Simultaneously with the chatbot response, the system alerts the appropriate human team:
- Slack/Teams alert: A message fires to the customer success channel with the customer's name, account value, NPS score, verbatim feedback, and one-click link to their account. This ensures a human reviews every detractor response, even if the chatbot handled the initial interaction.
- CRM flag: The customer record is tagged as "at-risk" with the detractor score and feedback. This changes the customer's priority in all future interactions.
- Support ticket: A high-priority ticket is created automatically with full conversation context, so the agent who follows up has complete information without asking the customer to repeat themselves.
Layer 3: Follow-up loop (24 hours to 30 days)
Recovery does not end with the initial response. The chatbot schedules follow-ups to close the loop:
- 24-hour follow-up: If the issue required human review, the chatbot checks back: "Hi [Name], we looked into the issue you raised yesterday about [topic]. Here is what we found and what we are doing about it: [update]. Does this address your concern?"
- 7-day follow-up: "We made some changes based on your feedback last week. Would you mind telling us if things have improved?" This is a micro-survey, not a full NPS -- just a quick thumbs-up/thumbs-down.
- 30-day re-survey: Trigger a new NPS survey to measure whether the recovery effort moved the needle. If the customer upgraded from detractor to passive or promoter, the recovery was successful.

Calculating the Revenue Impact of Detractor Recovery
Here is a simple formula to estimate the dollar value of your detractor recovery program:
Monthly detractor responses x recovery rate x average customer lifetime value = monthly revenue saved
Example: 200 detractor responses/month x 35% recovery rate x $2,000 average CLV = $140,000/month in saved revenue.
Without a chatbot feedback system, that recovery rate drops to 5-10% with email surveys, saving only $20,000-$40,000 -- a difference of $100,000+ per month. This is often the single highest-ROI use case for chatbot feedback collection. For a detailed breakdown of chatbot return on investment, see our chatbot ROI calculation guide. Real businesses achieving similar results are documented in our chatbot case studies with verified ROI data.
Integrating Feedback Data With HubSpot, Salesforce, and Slack
Collecting feedback in a chatbot is only valuable if that data flows into the systems where your teams actually work. A disconnected feedback silo creates extra manual effort and delays the actions that make feedback worthwhile. The goal is a fully connected feedback ecosystem where every NPS score, CSAT rating, and CES response automatically updates customer records, triggers workflows, and notifies the right people.
CRM Integration: HubSpot and Salesforce
Your CRM is the system of record for customer relationships, and it should store every piece of feedback alongside the customer's profile, purchase history, and interaction timeline.
HubSpot Integration
Connect Conferbot to HubSpot via the integration hub to achieve the following automated workflows:
- Contact property updates: Each NPS score is written to a custom contact property (e.g., "Latest NPS Score", "NPS Date", "NPS Segment"). This enables segmentation and filtering directly in HubSpot: build a list of all detractors from the last 90 days, or all promoters with revenue above $10,000.
- Timeline events: Each survey response creates a timeline event on the contact record with the score, follow-up comment, and chatbot conversation transcript. When a sales or success rep opens the contact, they see the complete feedback history without switching tools.
- Workflow triggers: Use HubSpot workflows to automate post-feedback actions. Example: if NPS score is 0-6, enroll the contact in a "Detractor Recovery" workflow that assigns a task to the account owner, sends an internal notification, and schedules a check-in call in 48 hours.
- Deal association: For B2B companies, associate NPS scores with active deals. If a contact involved in a $50,000 renewal gives a detractor score, the deal owner should know immediately -- before the renewal conversation.
Salesforce Integration
The Salesforce integration follows a similar pattern with platform-specific capabilities:
- Custom object for feedback: Create a custom "Feedback Response" object linked to Contacts and Accounts. Each chatbot survey response creates a new record with score, metric type (NPS/CSAT/CES), verbatim comment, channel, and timestamp.
- Account-level NPS rollup: Use Salesforce rollup fields to calculate an account-level NPS from all individual contact responses. This gives account managers a single number representing the entire account's sentiment.
- Churn prediction integration: Feed NPS trend data into Salesforce Einstein or your predictive analytics model. A declining NPS trajectory (e.g., 9 to 7 to 4 over three quarters) is one of the strongest churn predictors available.
- Report and dashboard embedding: Build Salesforce reports that segment NPS by account size, industry, product line, or geographic region. Embed these dashboards in leadership views for real-time visibility.
Communication Integration: Slack and Microsoft Teams
Real-time alerts ensure that feedback reaches the right people immediately, not when someone remembers to check a dashboard.
Slack Setup
- Dedicated feedback channel: Create a #customer-feedback channel that receives every survey response. Format the message to include: customer name, account value, score, metric type, verbatim comment, and a link to the customer's CRM record.
- Detractor alerts with @mentions: When a detractor response comes in, the Slack message @mentions the account owner and the CS team lead. Include urgency context: "Detractor alert: [Customer] (ARR: $24,000) scored 3 on NPS. Comment: 'Support took 3 days to respond to a critical issue.' @account-owner @cs-lead"
- Weekly digest: Post an automated weekly summary: total responses, NPS trend, top feedback themes, detractor recovery rate, and open recovery actions. This keeps the entire organization informed without requiring dashboard visits.
- Threaded discussions: Use Slack threads on feedback alerts for recovery discussions. The account owner can discuss the situation, assign actions, and update status directly in the thread, creating an audit trail of every recovery effort.
Microsoft Teams Setup
The Teams integration mirrors Slack with adaptive cards for richer formatting. Each feedback alert includes action buttons: "View in CRM", "Call Customer", "Assign to Me", and "Mark Resolved" -- enabling one-click action directly from the notification.
Analytics and BI Integration
For organizations that need advanced feedback analytics beyond what the CRM provides, connect chatbot feedback data to your business intelligence stack:
- Google BigQuery / Snowflake: Stream all feedback responses to a data warehouse for cross-referencing with product usage, revenue data, and support metrics. This enables analyses like "What is the NPS of customers who use Feature X vs. those who do not?"
- Looker / Tableau / Power BI: Build interactive dashboards that slice feedback data by any dimension. Combine NPS trends with revenue trends to visualize the correlation between customer sentiment and financial performance.
- Product analytics (Mixpanel, Amplitude): Connect feedback scores to product usage events. Identify which product behaviors correlate with promoter scores and which correlate with detractor scores, then optimize the product experience accordingly.
All integrations are configured through Conferbot's integration hub, which supports native connectors for major platforms and a webhook/API option for custom integrations. Setup typically takes 15-30 minutes per integration with no code required.
Analyzing Feedback Trends and Closing the Loop
The final and most important stage of any feedback program is what happens after the data is collected. Too many companies treat feedback as a vanity metric -- they track the NPS number, report it in quarterly reviews, and move on. The companies that actually improve are the ones that build a systematic process for analyzing feedback themes, distributing insights to the right teams, acting on those insights, and then measuring whether the action worked.
Building Your Feedback Analytics Framework
Organize your feedback analysis into four layers, each serving a different decision-making need:
Layer 1: Real-time monitoring (hourly/daily)
This is your early warning system. Monitor these signals continuously through Conferbot's analytics dashboard:
- NPS score trend (rolling 7-day average): A drop of more than 5 points in a single week warrants immediate investigation. Common causes include product bugs, pricing changes, support quality dips, or negative press.
- Detractor volume spike: If detractor responses exceed your baseline by more than 50% on any given day, something has gone wrong. Cross-reference with product incident logs, deployment timelines, and support ticket volume.
- Keyword frequency in open-ended feedback: The AI engine automatically tags and categorizes verbatim feedback. When a new keyword suddenly appears in 10%+ of responses (e.g., "slow", "crash", "confusing"), it signals an emerging issue.
Layer 2: Weekly insights (team level)
Distribute weekly feedback summaries to each team with the insights most relevant to their function:
- Product team: Top 5 feature requests from promoter and passive feedback, top 5 complaints from detractor feedback, CES scores for specific product flows, and feature-specific CSAT trends.
- Support team: Post-support CSAT trends, agent-level satisfaction scores (if tracked), common complaint categories, and average detractor recovery time.
- Marketing team: Promoter volume and review conversion rates, referral program uptake from promoter follow-ups, and testimonial-worthy feedback flagged for outreach.
- Executive team: Overall NPS trend with segment breakdown, detractor recovery rate and revenue impact, feedback volume and response rate health, and competitive mentions in open-ended feedback.
Layer 3: Monthly deep dive (strategic level)
Once per month, conduct a structured analysis that connects feedback data to business outcomes:
- NPS-to-churn correlation: What percentage of detractors churned within 90 days? What percentage of recovered detractors retained? This validates the ROI of your recovery program.
- Feedback-driven roadmap items: Which product improvements were made based on feedback? Did those improvements move the relevant metric? For example, if customers complained about slow onboarding and you simplified it, did CES scores for onboarding improve?
- Segment analysis: Break NPS down by customer plan, tenure, geography, acquisition channel, and industry. Identify which segments are improving and which are deteriorating, and investigate the reasons.
Layer 4: Quarterly review (organizational level)
Present a comprehensive feedback report to leadership that connects customer sentiment to business performance:
- NPS trend over 4 quarters with year-over-year comparison
- Revenue retention rate correlated with NPS segments
- Cost savings from chatbot-based feedback collection vs. previous survey methods
- Top 10 customer-requested improvements and their roadmap status
- Competitive positioning based on feedback mentions
Closing the Loop: The Action Framework
Analysis without action is academic. Every feedback insight must map to a specific action, owner, and timeline:
| Feedback Theme | Action Type | Owner | Timeline | Success Metric |
|---|---|---|---|---|
| Detractor: individual complaint | Recovery outreach | Account owner | Under 1 hour | Score improvement at 30-day re-survey |
| Recurring product complaint (10+ mentions) | Bug fix or UX improvement | Product manager | Current sprint | Complaint volume drops by 50%+ |
| Feature request from promoters | Roadmap consideration | Product lead | Next planning cycle | Feature adopted by 20%+ of requesters |
| Support quality concern | Agent coaching or process fix | Support manager | Within 1 week | Post-support CSAT improves by 0.3+ points |
| Pricing sensitivity from passives | Value communication campaign | Marketing lead | Within 2 weeks | Passive-to-promoter conversion improves |
The Continuous Improvement Flywheel
When done right, chatbot-based feedback creates a self-reinforcing flywheel:
- Collect: The chatbot gathers high-volume, high-quality feedback at every touchpoint
- Analyze: AI categorizes themes and surfaces actionable patterns across thousands of responses
- Act: Each theme maps to a specific team, action, and timeline
- Communicate: The chatbot tells customers about improvements made from their feedback: "You told us onboarding was too complex. We simplified it -- three fewer steps as of this week."
- Measure: Re-survey to confirm the improvement moved the metric
- Repeat: The cycle starts again with fresh data
Step 4 is the most commonly skipped and the most impactful. When customers see that their feedback leads to visible change, future response rates increase by 15-25%. They become more invested in the feedback process because they trust it works. This is the ultimate goal: a customer base that actively participates in improving your product because they have seen it happen before.
To get started building your own conversational feedback system, explore Conferbot's chatbot builder with pre-built NPS, CSAT, and CES templates. For teams that want to see their data in context, the analytics dashboard provides real-time feedback trend visualization with segment breakdowns and theme detection. To understand which metrics matter most for your chatbot analytics strategy, read our complete chatbot analytics metrics guide. View pricing plans to find the tier that matches your feedback volume, or browse chatbot templates for ready-to-deploy survey flows.
Was this article helpful?
Collect Customer Feedback With a Chatbot FAQ
Everything you need to know about chatbots for collect customer feedback with a chatbot.
About the Author
Conferbot Team specializes in conversational AI, chatbot strategy, and customer engagement automation. With deep expertise in building AI-powered chatbots, they help businesses deliver exceptional customer experiences across every channel.
View all articles
