
The Chatbot ROI Formula (With Real Numbers)
Before diving into spreadsheets or vendor demos, you need to understand the core formula that governs every chatbot investment decision. Chatbot ROI is not a single number -- it is the sum of measurable savings, measurable revenue gains, and measurable efficiency improvements, minus total cost of ownership. Once you internalize this formula, you can evaluate any chatbot platform, any vendor pitch, and any internal proposal with clarity. (source: Gartner prediction on chatbot adoption). (source: IBM research on AI cost savings).
The Master ROI Formula
Here is the formula used by finance teams at companies from startups to enterprises:
Where Total Value Generated breaks down into three pillars: (source: McKinsey on AI-driven business value).
- Support cost savings -- the money you stop spending on human handling of automatable conversations
- Revenue from lead capture and conversion -- the new revenue your chatbot generates through lead qualification, cart recovery, and upselling
- Operational efficiency gains -- the value of faster response times, 24/7 availability, and freed-up agent capacity
And Total Cost of Ownership includes:
- Platform subscription or development costs
- Implementation and setup labor
- Ongoing maintenance, optimization, and content updates
- Any per-conversation or API usage fees
Why This Formula Matters More Than You Think
Most businesses approach chatbot evaluation by comparing feature lists across vendors. That is the wrong starting point. The right starting point is understanding how much value a chatbot will generate for your specific business, then choosing the platform that maximizes that value relative to its cost. The formula above gives you the framework to do exactly that -- it transforms an emotional technology decision into a data-driven business decision.
Consider two scenarios. Company A spends $300/month on a feature-rich enterprise chatbot platform but achieves only 30% automation because they lack the resources to configure it properly. Company B spends $149/month on a simpler platform and achieves 60% automation because the setup is intuitive and they launched in three days instead of three months. Company B's ROI is dramatically higher despite the "inferior" platform. The formula forces you to focus on outcomes rather than features.
Worked Example: Mid-Size B2B SaaS Company
Let us walk through a concrete calculation. Imagine a B2B SaaS company with 15 employees, 3 support agents, and 2,500 monthly support conversations.
| ROI Component | Calculation | Monthly Value |
|---|---|---|
| Support cost savings | 1,500 automated conversations x $18 saved per conversation | $27,000 |
| Lead capture revenue | 45 new qualified leads x 12% close rate x $2,400 ACV | $12,960 |
| Cart/upsell revenue | N/A (B2B SaaS) | $0 |
| Efficiency gains (agent productivity) | 3 agents x 15 hours saved x $35/hr | $1,575 |
| Total monthly value | $41,535 | |
| Platform cost (Conferbot) | -$149 | |
| Maintenance labor (4 hrs x $50/hr) | -$200 | |
| Total monthly cost | -$349 | |
| Net monthly value | $41,186 |
Plugging into the formula:
That is not a typo. When a chatbot automates high-volume, high-cost-per-interaction conversations and simultaneously captures revenue, the ROI percentages are enormous because the denominator (platform cost) is so small relative to the value generated. Even if you cut every estimate in half for conservatism, you are looking at a 5,900% return.
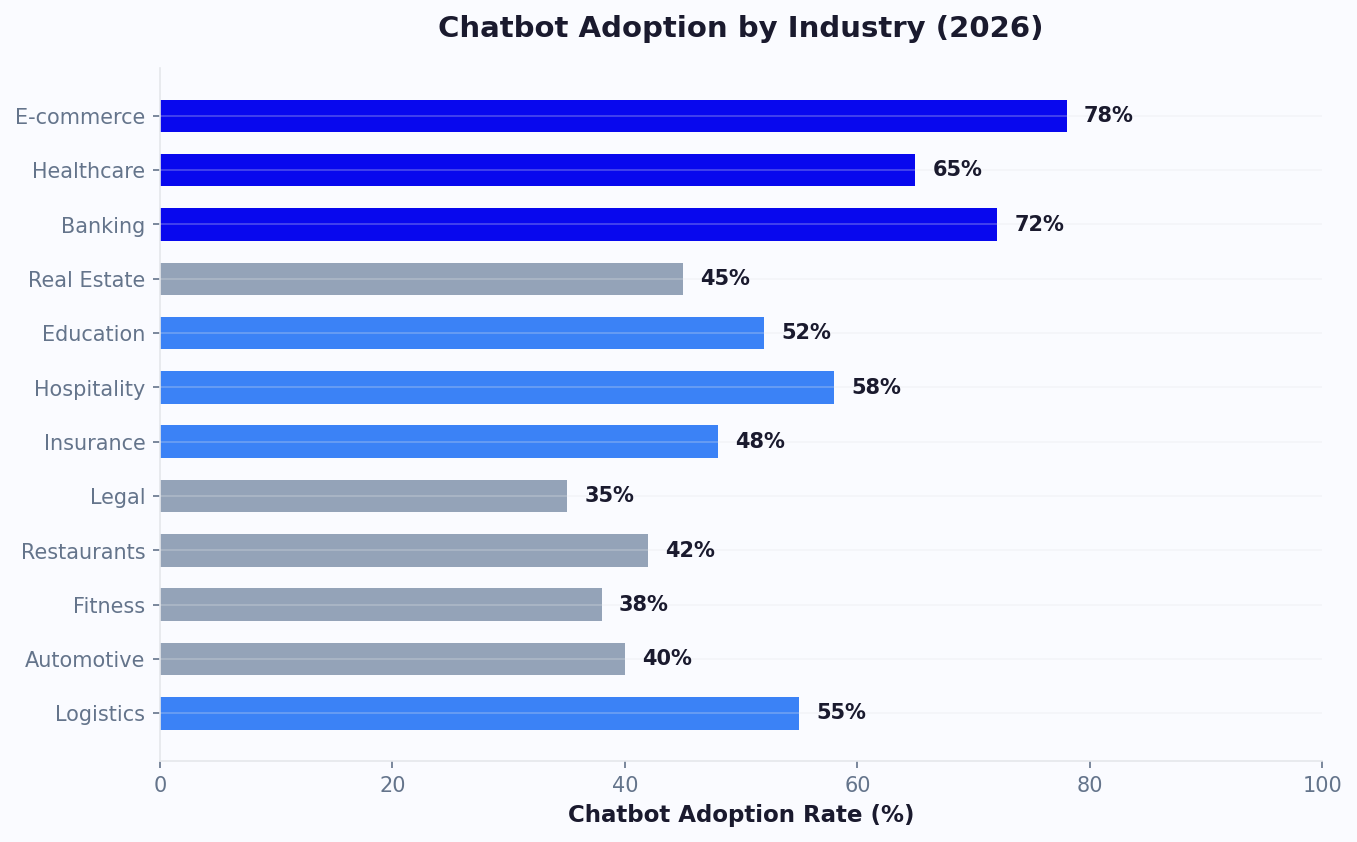
This is why Gartner projects that chatbots will be a primary customer service channel for a quarter of organizations. The economics are simply too compelling to ignore.
Why Most ROI Calculations Undercount
The most common mistake in chatbot ROI analysis is measuring only support cost savings and ignoring revenue impact. According to Forrester's Total Economic Impact methodology, businesses that measure only cost reduction underestimate chatbot value by 40-60%. The revenue from lead capture, conversion rate improvement, and cart recovery often exceeds the cost savings.
Another common error is failing to account for compounding benefits. Your chatbot does not generate the same value in month twelve that it generated in month one. As you refine conversation flows, expand the knowledge base, and add new use cases, the monthly value generated increases while the monthly cost remains essentially flat. This compounding effect means that first-year ROI projections, which are already strong, actually understate the multi-year return.
In the sections that follow, we will break down each component of this formula step by step so you can plug in your own numbers and arrive at a defensible ROI projection for your business.
Step 1: Calculate Your Current Cost Per Support Interaction
The foundation of every chatbot ROI calculation is understanding what you currently spend to handle a single customer support interaction. This number is the baseline against which chatbot savings are measured. Get it wrong, and your entire ROI model falls apart. Get it right, and the business case practically writes itself. (source: Forrester Total Economic Impact methodology).
The Cost-Per-Interaction Formula
What to Include in Total Monthly Support Cost
Many teams undercount their support costs by including only agent salaries. A complete accounting includes every expense associated with delivering customer support:
| Cost Category | What to Include | Typical Range |
|---|---|---|
| Agent compensation | Base salary + benefits + payroll taxes | $3,200-$6,500/agent/month |
| Management overhead | Team lead/manager salary allocated to support | $800-$2,000/agent/month |
| Software and tools | Helpdesk, CRM, phone system, QA tools | $100-$400/agent/month |
| Workspace | Office space, equipment, internet (or remote stipend) | $200-$800/agent/month |
| Training | Onboarding, ongoing training, knowledge base maintenance | $100-$300/agent/month |
| Quality assurance | QA reviews, compliance auditing, escalation handling | $50-$200/agent/month |
For a fully loaded support agent in the United States, the total cost typically falls between $4,500 and $10,000 per month. Divide that by the number of conversations they handle (typically 300-600 per month for chat/email, 150-300 for phone), and you get your cost per interaction.
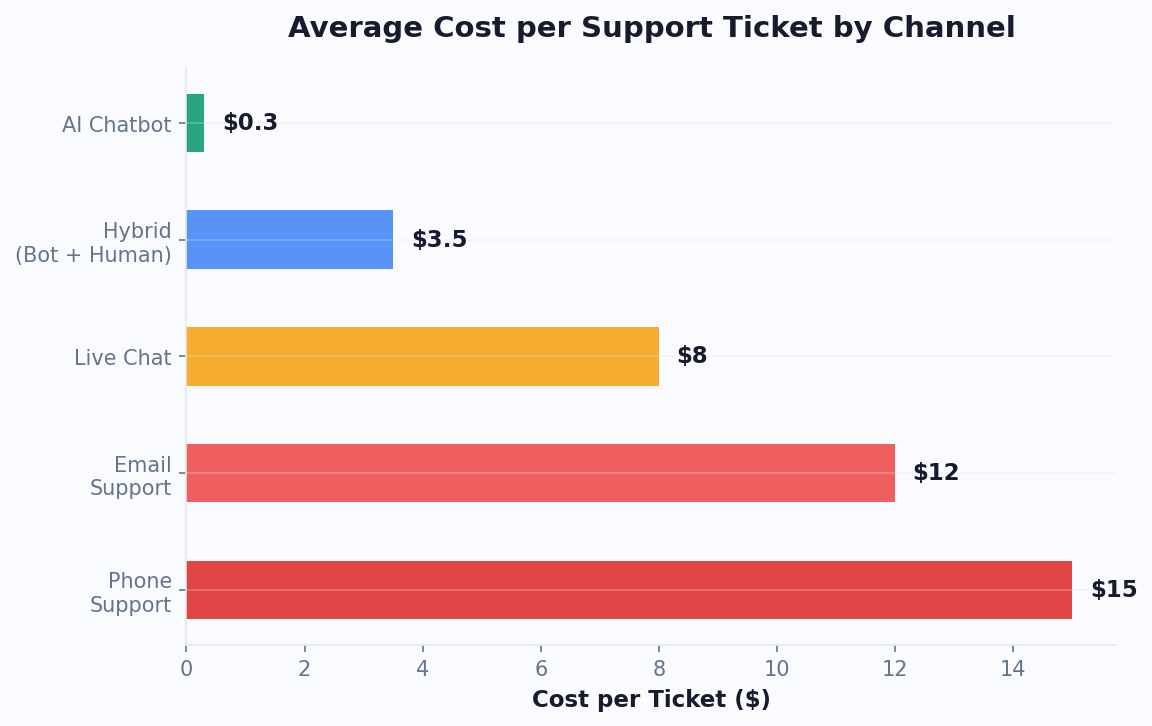
Industry Benchmarks for Cost Per Interaction
According to IBM's customer service research, the average cost per human-handled support interaction varies significantly by channel and complexity:
| Support Channel | Avg Cost Per Interaction | Avg Handle Time | Chatbot Cost Per Interaction |
|---|---|---|---|
| Phone support | $15-$25 | 6-10 minutes | $0.50-$2.00 |
| Email support | $8-$15 | 12-20 minutes | $0.50-$1.50 |
| Live chat (human agent) | $6-$12 | 8-14 minutes | $0.50-$1.50 |
| Social media support | $5-$10 | 5-15 minutes | $0.50-$1.00 |
| AI chatbot (automated) | $0.50-$2.00 | Under 2 minutes | -- |
The gap between human-handled and chatbot-handled interactions is where ROI lives. A $20 phone call replaced by a $1.00 chatbot interaction saves $19 per conversation. At 1,000 automated conversations per month, that is $19,000 in monthly savings from a single channel.
Worked Example: Calculating Your Baseline
Let us say you run a 4-person support team:
- Total agent cost: 4 agents x $5,500/month fully loaded = $22,000/month
- Management overhead: $3,000/month (portion of team lead's time)
- Tools and software: $1,200/month (helpdesk, phone, CRM)
- Total monthly support cost: $26,200/month
- Total conversations handled: 1,800/month
- Cost per interaction: $26,200 / 1,800 = $14.56 per interaction
Write this number down. You will use it in every subsequent step of the ROI calculation. If you use multiple channels, calculate the cost per interaction for each channel separately, because the savings differ when a chatbot replaces a $22 phone call versus a $7 chat conversation.
Common Mistakes When Calculating Cost Per Interaction
There are several pitfalls that lead to inaccurate cost-per-interaction numbers. First, using only base salary instead of fully loaded cost -- benefits, taxes, and overhead typically add 30-50% on top of base salary. Second, counting total conversations rather than conversations per channel, which obscures the true cost differential. Third, ignoring the cost of conversations that go unanswered -- every missed call, abandoned chat, or unresolved email has a cost in lost revenue and customer satisfaction, even though it does not appear in your helpdesk metrics.
Where to Find Your Numbers
Pull these figures from your helpdesk analytics (Zendesk, Freshdesk, Intercom), your HR/payroll system for fully loaded agent costs, and your finance team for overhead allocation. If you use live chat today, your platform likely reports conversations per agent and average handle time, which makes the calculation straightforward. If you do not have precise numbers, use the industry benchmarks above as starting estimates and refine as you gather data post-deployment.
Related: Chatbot Analytics: 10 Metrics You Must Track to Prove ROI in 2026
Step 2: Estimate Your Chatbot Automation Rate
Your automation rate -- also called containment rate or deflection rate -- is the percentage of incoming conversations that the chatbot resolves without any human intervention. This is the single most important variable in your ROI calculation because it determines how many of those expensive human interactions get replaced by low-cost automated ones.
What Drives Automation Rate
Three factors determine how many conversations your chatbot can fully automate:
- Query complexity distribution: What percentage of your incoming conversations are simple, repetitive questions (order status, pricing, hours, FAQ) versus complex, unique problems (billing disputes, technical debugging, complaints)?
- Chatbot sophistication: A rule-based FAQ bot automates far less than an AI chatbot trained on your knowledge base with access to backend systems.
- Knowledge base quality: An AI chatbot is only as good as the information it has access to. A comprehensive, well-organized knowledge base dramatically improves automation rates.
Realistic Automation Rate Benchmarks by Industry
Based on aggregated data from thousands of chatbot deployments, here are realistic automation rate ranges by industry and chatbot type:
| Industry | Rule-Based Bot | AI Bot (Basic) | AI Bot + Integrations | Common Automated Queries |
|---|---|---|---|---|
| E-commerce | 35-45% | 55-70% | 70-85% | Order status, returns, sizing, shipping |
| SaaS / Software | 25-35% | 45-60% | 60-75% | Login issues, feature questions, billing, onboarding |
| Healthcare | 30-40% | 45-55% | 55-70% | Appointments, insurance, directions, prep instructions |
| Real estate | 35-45% | 50-65% | 65-80% | Property details, viewing scheduling, qualification |
| Financial services | 25-35% | 40-55% | 55-70% | Account balance, transaction status, product info |
| Education | 40-50% | 55-70% | 70-85% | Admissions, schedules, campus info, financial aid |
| Travel / Hospitality | 35-45% | 50-65% | 65-80% | Booking changes, amenities, directions, availability |
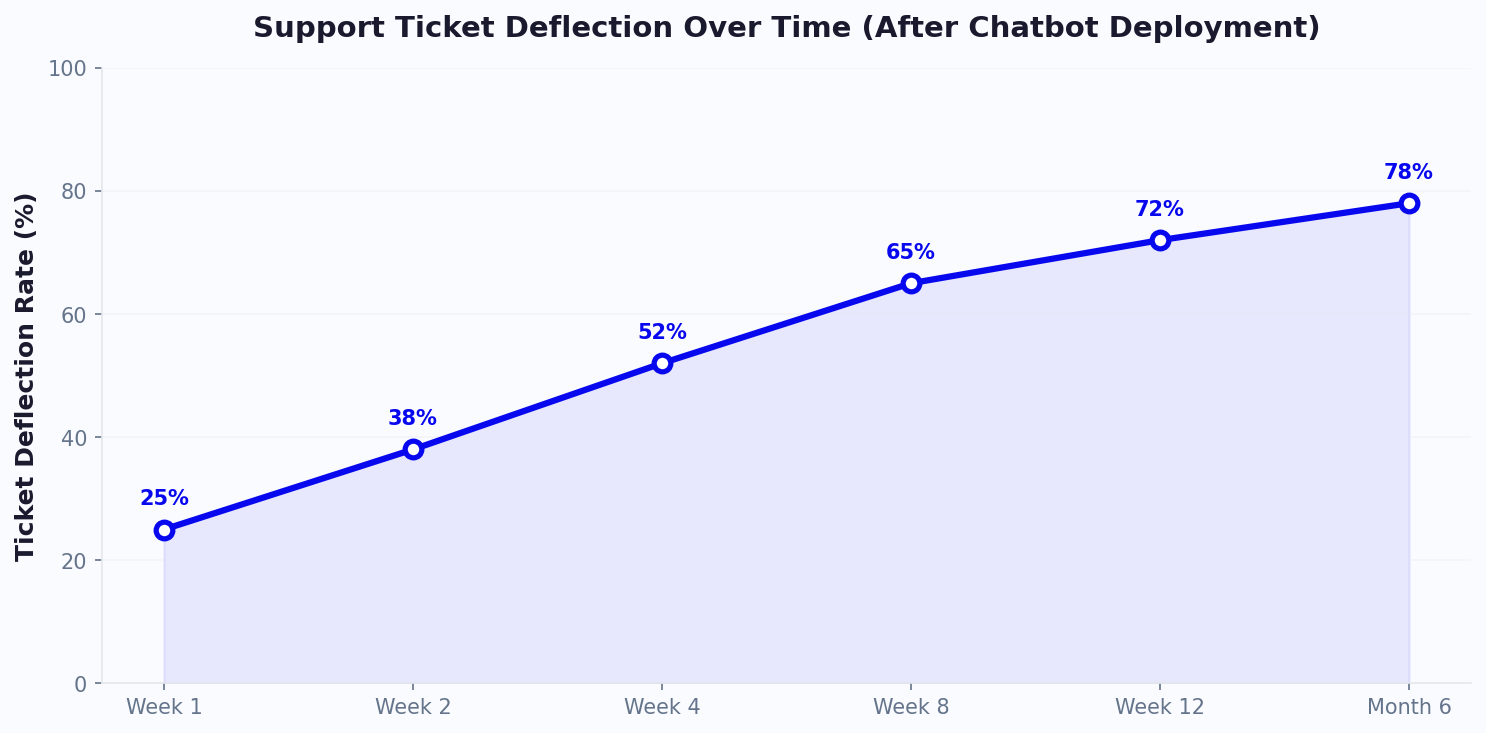
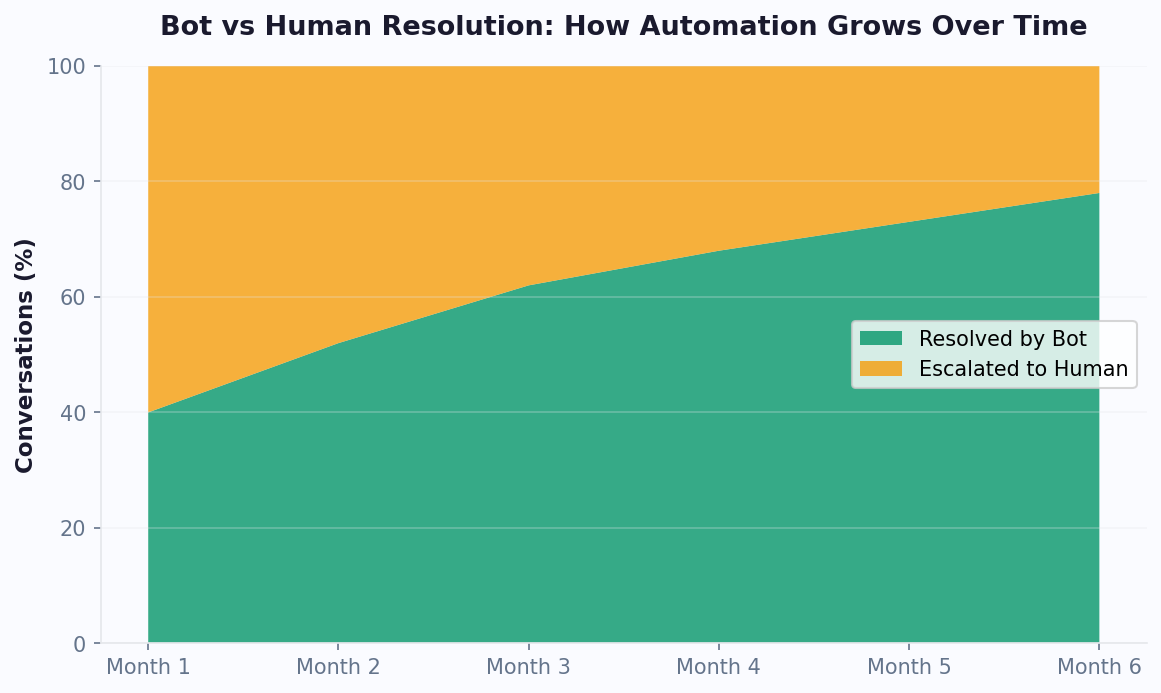
The industry average for AI chatbots with knowledge base integration is 35-50% ticket deflection in the first 90 days, rising to 50-70% after six months of optimization. This aligns with data from Forrester's research on chatbot automation effectiveness.
How to Estimate Your Specific Automation Rate
Do not guess. Audit your actual conversation data to determine what percentage falls into automatable categories:
- Export your last 500 support conversations from your helpdesk or live chat tool
- Categorize each conversation by topic (order status, pricing question, technical issue, billing inquiry, complaint, etc.)
- Tag each category as "fully automatable," "partially automatable," or "requires human"
- Calculate the percentage of conversations in the "fully automatable" bucket
Most businesses are surprised to find that 50-70% of their conversations are simple, repetitive queries that follow predictable patterns. These are prime candidates for chatbot automation.
The Partially Automatable Category Matters Too
Do not ignore the "partially automatable" bucket. These are conversations where the chatbot handles the first 2-3 exchanges (gathering context, verifying identity, checking basic information) before handing off to a human agent. Even partial automation reduces average handle time by 30-50% because the agent receives a pre-qualified, context-rich handoff instead of starting from scratch. This means your human agents handle their remaining conversations faster, which translates to either fewer agents needed or more conversations handled per agent.
Plugging Automation Rate Into Your ROI Model
Using the numbers from Step 1:
- Total monthly conversations: 1,800
- Cost per human interaction: $14.56
- Estimated automation rate (conservative): 50%
- Conversations automated: 1,800 x 50% = 900/month
- Cost per chatbot interaction: $1.00
- Savings per automated conversation: $14.56 - $1.00 = $13.56
- Monthly support cost savings: 900 x $13.56 = $12,204/month
- Annual support cost savings: $146,448/year
Even at a conservative 50% automation rate, the cost savings alone are substantial. As you refine your chatbot flows and expand your analytics-driven optimization, the automation rate typically increases 10-20 percentage points over the first six months.
A critical nuance: do not set your initial target at the maximum achievable rate. Start with a conservative 40-50% target for your first 90 days, then set incremental improvement targets of 5 percentage points per quarter. This approach sets realistic expectations with leadership while giving your team a clear optimization roadmap.
Related: Chatbot vs Email Support: Which Wins on Cost, Speed, and Satisfaction?
Step 3: Factor in Revenue From Lead Capture and Conversion
Cost savings get the headlines, but revenue generation is often where chatbots deliver even more value. A chatbot that engages website visitors, qualifies leads, and routes them to sales is not just a cost center -- it is a revenue engine. Ignoring this component means dramatically undervaluing your chatbot investment.
The Lead Capture ROI Formula
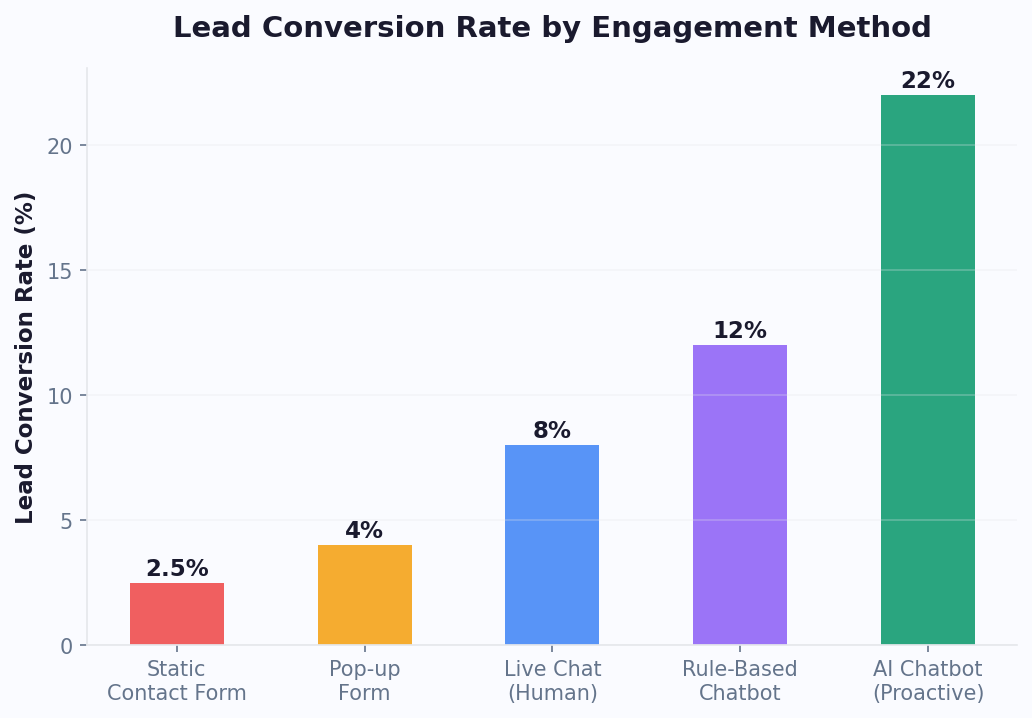
Why Chatbots Outperform Static Forms
Traditional contact forms convert 2-5% of visitors. Chatbots engage visitors in conversation, qualifying them in real time and capturing contact information through dialogue rather than demanding it upfront. Research from HubSpot's marketing data shows that conversational lead capture achieves a 67% increase in lead generation compared to static forms.
The mechanics are straightforward: a chatbot proactively greets visitors based on behavior triggers (time on page, scroll depth, exit intent), answers their immediate questions, and naturally transitions to lead capture once rapport is established. This feels helpful rather than demanding, which is why engagement and conversion rates are dramatically higher. The visitor gets value (answers to their questions) before being asked to give value (their contact information), which inverts the traditional form paradigm and eliminates the friction that kills most lead capture attempts.
Lead Capture Benchmarks
| Metric | Static Contact Form | AI Chatbot | Improvement |
|---|---|---|---|
| Visitor engagement rate | 5-10% click through | 15-35% initiate conversation | +150-250% |
| Lead capture rate (of engaged visitors) | 20-40% | 35-55% | +50-80% |
| Lead qualification accuracy | Manual (post-capture) | Real-time via conversation | 40-60% fewer unqualified leads |
| Average time to capture | Requires page visit + form fill | Proactive engagement within 15 seconds | 3-5x faster |
| After-hours lead capture | Form only, no qualification | Full qualification + booking | 35-50% of leads occur after hours |
Worked Example: Lead Generation ROI
Consider a B2B services company with a website chatbot:
- Monthly website visitors: 15,000
- Chatbot engagement rate: 4% = 600 conversations/month
- Lead capture rate: 25% of engaged visitors = 150 leads/month
- Lead-to-customer conversion: 10% = 15 new customers/month
- Average customer lifetime value: $3,600
- Monthly revenue from chatbot leads: 15 x $3,600 = $54,000
Even discounting for attribution (not all of those customers would have been completely lost without the chatbot), assigning 50% credit to the chatbot still yields $27,000/month in attributed revenue. This is a conservative attribution model -- many analytics platforms use first-touch or multi-touch attribution that would credit the chatbot with a higher percentage.
Measuring Lead Quality, Not Just Quantity
A chatbot that generates 500 unqualified leads per month is less valuable than one that generates 100 highly qualified leads. The real ROI multiplier is lead qualification during the conversation. With Conferbot's AI chatbot builder, you can configure qualification questions (budget, timeline, authority, need) directly in the conversation flow, so your sales team receives leads that are already scored and ready for follow-up.
Track lead quality by connecting your chatbot to your CRM and measuring:
- Chatbot-sourced lead-to-opportunity conversion rate
- Average deal size from chatbot-sourced leads vs. other channels
- Sales cycle length for chatbot-qualified vs. unqualified leads
- Cost per qualified lead from chatbot vs. paid advertising channels
Most businesses find that chatbot-qualified leads convert 20-30% faster because the chatbot has already established interest, captured requirements, and set expectations before the sales conversation begins. The sales team spends less time qualifying and more time closing, which amplifies the revenue impact beyond what the raw lead numbers suggest.
After-Hours Lead Capture: The Hidden Revenue Stream
35-50% of website traffic occurs outside business hours. Without a chatbot, those visitors see a static form at best. With a chatbot, they get immediate engagement, answers to buying questions, and seamless lead capture or appointment booking. This after-hours revenue is often the most incremental because it represents visitors who had zero chance of converting through traditional channels.
Think about this from the visitor's perspective. A potential customer lands on your site at 9 PM after researching solutions all evening. They have specific questions about your pricing, capabilities, or implementation timeline. Without a chatbot, they either fill out a generic form (low probability) or leave and continue researching competitors (high probability). With a chatbot, they get immediate answers, feel confident in your solution, and schedule a demo or leave their contact information while the conversation is still fresh. By the time your sales team arrives the next morning, they have a warm, qualified lead waiting in the CRM instead of an anonymous bounce in Google Analytics.
Related: Chatbot vs Phone Support: A Complete Cost and Performance Comparison
Step 4: Account for Cart Recovery and Upsell Revenue
For e-commerce businesses, cart recovery and upselling represent a massive ROI component that is often underestimated. The average cart abandonment rate across all industries is 70.19%, according to the Baymard Institute. Every abandoned cart is revenue left on the table -- and chatbots are uniquely positioned to recover it because they intervene at the exact moment of abandonment rather than following up hours later.
The Cart Recovery ROI Formula
How Chatbots Recover Abandoned Carts
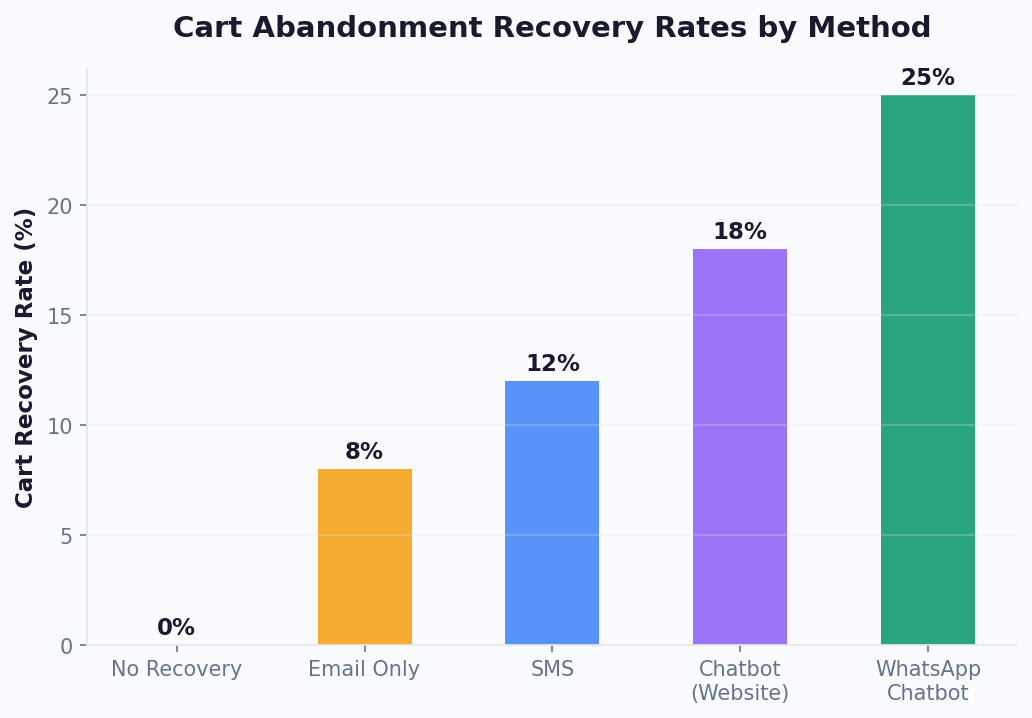
Unlike email-only recovery sequences (which achieve 3-5% recovery rates), chatbots engage visitors at the moment of abandonment through proactive triggers:
- Exit-intent detection: When a visitor moves to leave the checkout page, the chatbot offers help, addresses objections, or provides an incentive
- Inactivity triggers: If a visitor stalls on the cart page for 60+ seconds, the chatbot proactively asks if they have questions about shipping, sizing, or payment
- Multi-channel follow-up: For visitors who leave, WhatsApp or SMS follow-up within 30 minutes achieves 15-25% open rates and 5-10% recovery rates
- Objection handling: The chatbot identifies and addresses the top abandonment reasons -- unexpected shipping costs, payment security concerns, complicated checkout process, need to compare prices -- in real time during the conversation
Cart Recovery Benchmarks
| Recovery Method | Recovery Rate | Timing | Cost Per Recovery |
|---|---|---|---|
| Email only | 3-5% | 1-24 hours after abandonment | $0.10-$0.50 |
| Email + SMS | 5-8% | 30 min - 24 hours | $0.25-$1.00 |
| Chatbot (on-site intervention) | 10-18% | Real-time at moment of abandonment | $0.50-$2.00 |
| Chatbot + WhatsApp follow-up | 15-25% | Real-time + 30 min follow-up | $0.75-$2.50 |
The timing advantage is critical. A chatbot intervenes when purchase intent is at its highest -- the visitor has already selected products and reached the cart or checkout page. An email arrives hours later when the visitor has moved on, forgotten their motivation, or already purchased from a competitor. This timing difference alone explains why chatbot recovery rates are 3-5x higher than email recovery rates.
Worked Example: E-Commerce Cart Recovery
- Monthly website orders: 800
- Cart abandonment rate: 70% = approximately 1,867 abandoned carts
- Chatbot recovery rate: 12%
- Recovered carts: 1,867 x 12% = 224 recovered orders/month
- Average cart value: $95
- Monthly recovered revenue: 224 x $95 = $21,280
- Annual recovered revenue: $255,360
At a platform cost of $149/month, the cart recovery component alone delivers a 1,090% monthly return. And this is using a conservative 12% recovery rate -- businesses with well-optimized chatbot flows routinely achieve 15-20%.
Upsell and Cross-Sell Revenue
Beyond recovering lost carts, chatbots actively increase average order value through intelligent product recommendations during the shopping conversation:
- Product recommendations: "Customers who bought X also bought Y" delivered conversationally rather than as a static widget
- Bundle suggestions: "Add the protective case for 20% off when purchased with your phone"
- Upgrade prompts: "The Pro version includes free shipping and extended warranty for just $30 more"
- Complementary accessories: "This dress pairs perfectly with these earrings -- would you like to see them?"
Typical upsell impact from well-configured chatbots:
- Average order value increase: 10-25%
- Upsell acceptance rate: 8-15% of chatbot conversations
- Cross-sell conversion rate: 5-12% of chatbot conversations
Worked Example: Upsell Revenue
- Monthly chatbot-assisted purchases: 300
- Upsell offer rate: 100% (every purchase conversation gets a relevant suggestion)
- Upsell acceptance rate: 12%
- Average upsell value: $28
- Monthly upsell revenue: 300 x 12% x $28 = $1,008/month
Total E-Commerce Chatbot Revenue Impact
| Revenue Source | Monthly | Annual |
|---|---|---|
| Cart recovery | $21,280 | $255,360 |
| Upsell/cross-sell | $1,008 | $12,096 |
| Lead capture (email subscribers) | $2,400 | $28,800 |
| Total revenue impact | $24,688 | $296,256 |
If your business does not sell products online, this step may not apply directly. However, service businesses can substitute appointment booking revenue, consultation scheduling value, and quote-to-close conversion improvement for the e-commerce metrics above. A real estate chatbot that books one additional property viewing per day, leading to one additional sale per month at $8,000 commission, generates $96,000 in annual revenue impact. A healthcare chatbot that reduces no-shows by 25% recovers $50-$200 per prevented no-show. The principle is the same across industries: chatbots convert intent into action at the moment of highest engagement.
Related: Chatbot Lead Qualification: Score, Route, and Convert Leads Automatically
Step 5: Subtract Implementation and Maintenance Costs
An honest ROI calculation requires an honest accounting of costs. Too many chatbot vendors emphasize savings while glossing over the total cost of ownership. Here is a transparent breakdown of what you will actually spend, regardless of which platform you choose.
Implementation Cost Breakdown
| Cost Category | No-Code Platform | Agency Build | Custom Development |
|---|---|---|---|
| Platform/license setup | $0-$200 | $0-$200 (platform fee) | $0 |
| Conversation design | $0 (DIY, 8-15 hrs) | $2,000-$8,000 | $3,000-$12,000 |
| Knowledge base creation | $0 (DIY, 4-8 hrs) | $1,000-$3,000 | $2,000-$8,000 |
| Integration setup | $0 (native, 1-2 hrs) | $500-$2,000 | $5,000-$20,000 |
| Development/coding | $0 | $0-$2,000 | $25,000-$150,000 |
| Testing and QA | $0 (DIY, 2-4 hrs) | $500-$1,500 | $3,000-$12,000 |
| Total implementation | $0-$200 + 15-30 hrs labor | $4,000-$16,700 | $38,000-$202,000 |
For the no-code path, the primary "cost" is your team's time. At $50/hour internal labor cost, 20 hours of setup equals $1,000. That is the fully loaded implementation cost for a platform like Conferbot.
Monthly Ongoing Costs
| Cost Category | No-Code Platform | Agency Managed | Custom Built |
|---|---|---|---|
| Platform subscription | $49-$299/month | $49-$299/month | $0 |
| Cloud hosting | Included | Included | $200-$2,000/month |
| LLM API costs | Included or $0.01-0.05/conv | Included | $500-$5,000/month |
| Maintenance/optimization | 2-4 hrs/month (internal) | $500-$3,000/month | $2,000-$8,000/month |
| Content updates | 1-2 hrs/month (internal) | Included in retainer | $500-$2,000/month |
| Total monthly ongoing | $149-$499 + 3-6 hrs | $749-$3,599 | $3,200-$17,000 |
The No-Code Cost Advantage
For most businesses, the no-code platform path delivers overwhelmingly superior ROI because the cost denominator is so small. When you are spending $149/month on a platform that saves $12,000+/month, the ROI percentage becomes astronomical. Custom development can deliver the same absolute savings, but the percentage ROI is much lower because the cost base is 50-100x higher.
This does not mean no-code is always the right choice. If you are a large enterprise processing 100,000+ conversations per month with deep integrations into proprietary systems, custom development may be necessary. But for 90% of businesses -- from solo founders to mid-market companies -- no-code platforms provide more than enough capability at a fraction of the cost.
Costs That Most Vendors Do Not Tell You About
Watch for these hidden costs that inflate your total cost of ownership:
- Per-conversation fees: Some platforms charge $0.50-$2.00 per AI-resolved conversation on top of the subscription. At 2,000 conversations/month, that adds $1,000-$4,000/month. Ask before you commit.
- WhatsApp Business API fees: Meta charges per-conversation fees for WhatsApp Business ($0.02-$0.08 per conversation depending on region). This is independent of your chatbot platform.
- Overage charges: Understand what happens when you exceed plan limits. Some platforms throttle, others charge steep overages.
- Migration costs: If you start on one platform and need to switch, you lose all conversation flows, training data, and integrations. Choose a platform you can grow with.
- Opportunity cost of downtime: During implementation, your chatbot is not live. For no-code platforms, implementation takes days. For custom builds, it takes months. Every month without a chatbot is a month of unrealized savings.
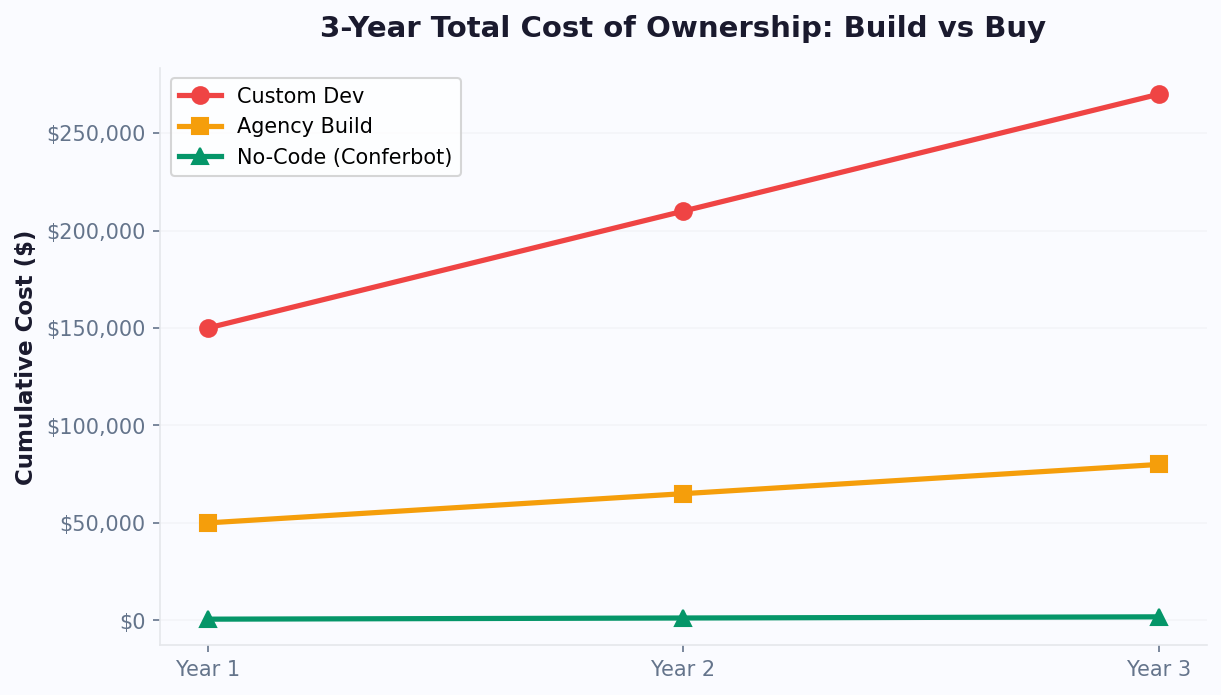
Honest Cost Comparison Over 3 Years
| Cost Component | No-Code (Conferbot) | Agency Build | Custom Development |
|---|---|---|---|
| Year 1 total | $2,788 | $22,700 | $90,000 |
| Year 2 total | $1,788 | $12,000 | $60,000 |
| Year 3 total | $1,788 | $12,000 | $60,000 |
| 3-year total | $6,364 | $46,700 | $210,000 |
The 3-year cost difference between no-code and custom development is $203,636. Unless custom development delivers capabilities that generate $200,000+ more in value than a no-code platform, the no-code path wins on ROI every time. Check Conferbot pricing for transparent plan details with no per-conversation fees on paid plans.
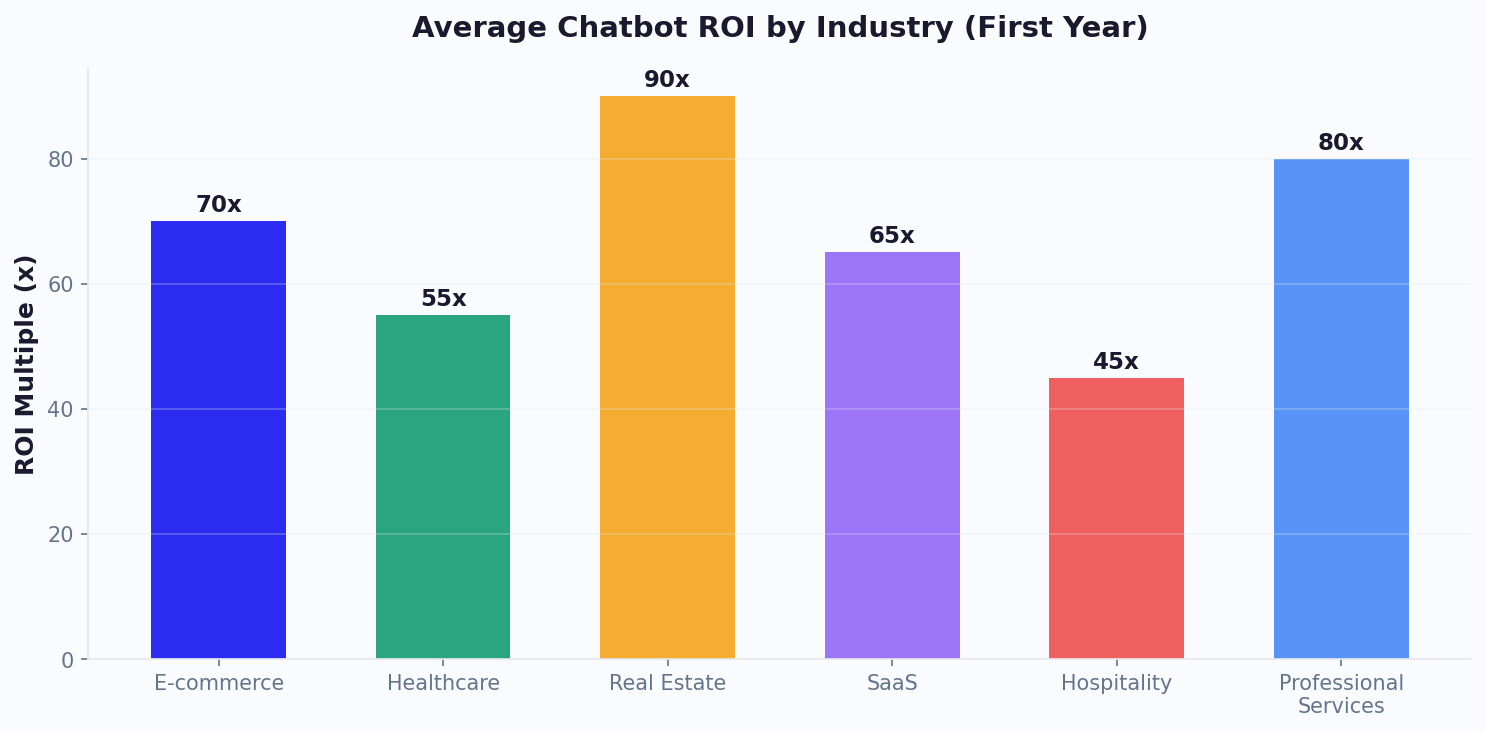
Industry Benchmarks: What ROI to Expect by Business Type
ROI varies significantly by industry because the key variables -- conversation volume, cost per interaction, average customer value, and automation rate -- differ across sectors. This section provides comprehensive benchmarks so you can calibrate your expectations and set realistic targets for your specific business type.
Comprehensive ROI Benchmark Table
| Industry | Avg Monthly Conversations | Avg Cost Per Human Interaction | Typical Automation Rate | Monthly Support Savings | Monthly Revenue Impact | Typical Year 1 ROI |
|---|---|---|---|---|---|---|
| SaaS / Software | 2,000-8,000 | $15-$22 | 50-65% | $8,000-$35,000 | $10,000-$40,000 | 800-5,000% |
| E-Commerce | 3,000-15,000 | $8-$15 | 60-80% | $6,000-$25,000 | $15,000-$60,000 | 400-3,000% |
| Healthcare | 1,500-6,000 | $18-$28 | 40-60% | $5,000-$20,000 | $4,000-$15,000 | 300-2,000% |
| Real Estate | 500-3,000 | $12-$20 | 55-70% | $2,000-$10,000 | $15,000-$80,000 | 500-4,000% |
| Financial Services | 2,000-10,000 | $18-$30 | 45-60% | $8,000-$40,000 | $6,000-$25,000 | 600-3,500% |
| Education | 1,000-5,000 | $10-$18 | 55-75% | $3,000-$15,000 | $5,000-$20,000 | 400-2,500% |
| Travel / Hospitality | 2,000-8,000 | $10-$18 | 55-70% | $5,000-$20,000 | $8,000-$30,000 | 500-3,000% |
| Professional Services | 300-2,000 | $15-$25 | 45-60% | $1,500-$8,000 | $8,000-$50,000 | 400-3,000% |
Deep Dive: SaaS / Software
SaaS companies see high ROI because their support conversations are highly repetitive (password resets, feature questions, billing inquiries, integration troubleshooting) and their customer lifetime values justify significant investment in lead capture. A SaaS chatbot on the marketing site qualifies demo requests while the support chatbot deflects tier-1 tickets. The dual revenue-and-savings impact makes SaaS one of the highest-ROI verticals for chatbot deployment.
Key SaaS metrics:
- Average support ticket cost: $15-$22 (blended across chat, email, phone)
- Tier-1 ticket automation rate: 55-70% with AI + knowledge base
- Demo request conversion lift from chatbot: 25-45%
- Average months to full ROI realization: 1-2 months
- Typical annual savings for a 5-agent SaaS support team: $120,000-$250,000
Deep Dive: E-Commerce
E-commerce chatbots deliver the broadest ROI because they impact every stage of the customer journey -- pre-purchase product guidance, cart recovery, order tracking, and returns processing. The revenue impact from cart recovery alone often exceeds all other ROI components combined. E-commerce also benefits from the highest automation rates because most customer queries are transactional and data-driven (order status, shipping estimates, return policies) rather than subjective or complex.
Key e-commerce metrics:
- Average support ticket cost: $8-$15 (lower because many queries are simple order status checks)
- Cart recovery rate with chatbot: 10-18% (versus 3-5% with email only)
- AOV increase from chatbot product recommendations: 10-25%
- Average months to full ROI realization: Under 1 month
- Typical annual revenue impact for a mid-size e-commerce store: $200,000-$500,000
Deep Dive: Healthcare
Healthcare chatbots command premium ROI because the cost per human interaction is high (compliance requirements, trained staff) and the volume of repetitive administrative queries is enormous (appointment scheduling, insurance verification, preparation instructions). The constraint is compliance -- healthcare chatbots must be HIPAA-aware and carefully scoped to avoid providing medical advice or handling protected health information improperly.
Key healthcare metrics:
- Average support interaction cost: $18-$28 (higher due to compliance requirements)
- Appointment scheduling automation: 60-80% of scheduling requests
- No-show reduction from automated reminders: 25-40%
- Patient satisfaction improvement: 15-25% increase in front-desk satisfaction scores
- Average months to full ROI realization: 2-3 months
Deep Dive: Real Estate
Real estate chatbots have outsized revenue impact relative to support savings because each qualified lead can be worth $5,000-$30,000 in commission. A chatbot that qualifies property inquiries, schedules viewings, and captures buyer profiles generates enormous per-lead value even at modest conversion rates. Real estate also benefits heavily from after-hours automation because property searches peak in the evening when agents are unavailable.
Key real estate metrics:
- Average support interaction cost: $12-$20
- Lead qualification automation: 55-70%
- Viewing scheduling automation: 60-80%
- Revenue per chatbot-qualified lead: $500-$3,000 (commission fraction)
- Average months to full ROI realization: 1-2 months
- Typical annual revenue impact for a brokerage: $150,000-$600,000
What If Your Industry Is Not Listed?
Use these guidelines to estimate your ROI:
- If your average transaction value is high (over $500), revenue impact will dominate your ROI
- If your conversation volume is high (over 1,000/month), support savings will dominate
- If both are high, expect ROI in the top range (2,000%+)
- If your cost per human interaction exceeds $15, even modest automation rates produce strong ROI
- If most of your queries are repetitive and follow predictable patterns, expect automation rates above 50%
For a personalized estimate using your specific numbers, use the Conferbot ROI calculator. It models all four ROI components based on your industry, conversation volume, and average customer value.
When Will You Break Even? Timeline by Business Size
The break-even point -- the moment your chatbot has generated enough value to cover its total cost -- is the metric that matters most to finance teams and budget holders. Unlike many technology investments that require 12-18 months to show returns, chatbots consistently deliver some of the fastest payback periods in business software. Understanding your specific break-even timeline helps you set expectations, secure budget approval, and define early success metrics.
The Break-Even Formula
Break-Even Timeline by Business Size
| Business Size | Monthly Conversations | Implementation Path | Implementation Cost | Monthly Net Value | Break-Even Point |
|---|---|---|---|---|---|
| Solo / Micro (1-5 employees) | 100-500 | No-code free/starter | $0-$500 | $500-$3,000 | Under 1 week |
| Small business (5-25 employees) | 500-2,000 | No-code professional | $500-$1,500 | $3,000-$15,000 | 1-2 weeks |
| Mid-market (25-200 employees) | 2,000-10,000 | No-code enterprise or agency | $1,500-$20,000 | $15,000-$80,000 | 1-4 weeks |
| Enterprise (200+ employees) | 10,000-100,000 | Custom + platform hybrid | $50,000-$200,000 | $80,000-$500,000 | 1-4 months |
Why No-Code Platforms Break Even Fastest
The math is simple: when implementation cost is near zero and monthly platform cost is $49-$299, you need very little value generation to break even. A single automated conversation that would have cost $15 as a human interaction generates $13-$14.50 in net savings. At $149/month, you break even by automating just 10-11 conversations per month. Most businesses automate hundreds or thousands.
Compare this to custom development, where a $100,000 implementation cost requires $100,000 in cumulative net value before reaching break-even. Even at $50,000/month in net value, that takes two months -- and the clock does not start until the build is complete (3-6 months away). The total time from decision to break-even for custom development is typically 5-10 months, versus 1-7 days for no-code.
Accelerating Your Break-Even Timeline
Five strategies to reach break-even faster:
- Start with your highest-volume, simplest queries: Automate order status, pricing questions, hours/location, and password resets first. These have the highest automation success rate and generate immediate savings.
- Deploy on your highest-traffic channel first: If your website gets 10x the traffic of your WhatsApp, deploy there first for maximum immediate impact.
- Enable proactive engagement: Do not wait for visitors to click the chat icon. Use behavior triggers (time on page, scroll depth, URL patterns) to proactively offer help. This increases engagement rates 2-3x.
- Connect lead capture to your CRM immediately: Revenue from chatbot-captured leads accelerates break-even dramatically but only if those leads enter your sales pipeline on day one.
- Use pre-built templates for your industry: Templates encode best practices from thousands of deployments. Starting from a template instead of a blank canvas cuts setup time by 50-70% and improves day-one performance.
Modeling Your Own Break-Even Point
Here is a step-by-step guide to calculate your specific break-even:
- Determine implementation cost: For no-code, this is setup labor (hours x internal rate). For agency or custom, get a fixed quote.
- Calculate monthly value using Steps 1-4 above: Support savings + lead revenue + cart recovery + efficiency gains.
- Subtract monthly ongoing cost: Platform subscription + maintenance labor + any per-conversation fees.
- Divide implementation cost by monthly net value: The result is your break-even in months.
For most no-code deployments, the break-even calculation is almost academic because the implementation cost is so low that a single day of chatbot operation generates enough value to cover it.
Worked Example: Break-Even for a 10-Person Consulting Firm
Let us walk through a concrete break-even calculation for a professional services firm:
- Implementation cost: 15 hours setup x $60/hour internal rate = $900
- Monthly platform cost: $149 (Conferbot professional plan)
- Monthly support savings: 200 automated conversations x $16 cost per interaction = $3,200
- Monthly lead revenue: 8 new qualified leads x 15% close rate x $5,000 average engagement = $6,000
- Monthly net value: ($3,200 + $6,000) - $149 = $9,051
- Break-even: $900 / $9,051 = 0.1 months (approximately 3 days)
After break-even, the firm generates over $9,000 in net value every month from a $149 platform investment. Over twelve months, that is $108,612 in value from $1,788 in platform costs -- a 5,974% ROI.
Use the Interactive Calculator
Rather than doing this math by hand, use the Conferbot chatbot ROI calculator. Enter your monthly conversations, average cost per interaction, website traffic, and average customer value, and get an instant projection of monthly savings, revenue impact, total ROI, and break-even timeline. The calculator uses the same formulas and benchmarks described in this guide, calibrated by industry.
What Happens After Break-Even
Break-even is just the beginning. Chatbot ROI compounds over time because:
- Automation rate improves: As you refine flows and expand the knowledge base based on real conversation data from your analytics dashboard, automation rate typically increases 10-20 percentage points in the first six months.
- Conversation volume grows: As your business grows, your chatbot scales at near-zero marginal cost while human support costs scale linearly.
- New use cases emerge: Most businesses start with support automation and later add lead generation, appointment booking, onboarding, and internal support -- each adding new ROI streams on the same platform cost.
- Team efficiency compounds: Agents freed from routine queries become experts in complex issues, improving resolution quality and customer satisfaction over time.
The businesses that extract the most long-term value from their chatbot investment are those that treat it as a living system -- continuously optimized, expanded, and measured -- rather than a one-time deployment. Track your ROI monthly for the first quarter, then quarterly, using the same framework outlined in this guide. The numbers will consistently exceed initial projections as your chatbot matures.
If you are ready to calculate your specific ROI and get started, build your first chatbot for free on Conferbot. Most businesses go from signup to live chatbot in under an hour, with break-even measured in days rather than months.
Was this article helpful?
Build and deploy in 10 minutes. No coding needed.
How to Calculate Chatbot ROI FAQ
Everything you need to know about chatbots for how to calculate chatbot roi.
About the Author
Conferbot Team specializes in conversational AI, chatbot strategy, and customer engagement automation. With deep expertise in building AI-powered chatbots, they help businesses deliver exceptional customer experiences across every channel.
View all articles

