
Why Chatbot Case Studies Should Drive Your Investment Decision
Every AI chatbot vendor publishes impressive claims on their landing pages: "Automate 80% of support," "Generate 3x more leads," "Save $50K per month." The problem is that these claims are usually aggregate projections or cherry-picked success metrics. When you are building a business case for your board, your CFO, or even yourself, you need documented, verifiable results from real companies that look like yours.
In 2026, the chatbot market has matured beyond the hype phase. Businesses are no longer asking "Should we deploy a chatbot?" — they are asking "What specific return can we expect, and how long will it take?" That is why case studies are the most valuable resource in your evaluation process.
The global chatbot market is projected to reach $15.5 billion by 2028 (MarketsandMarkets, 2025). McKinsey's research on AI in customer engagement further indicates that early AI adopters achieve 20-30% revenue uplift from improved customer experience, growing at a 23.3% CAGR. Gartner predicts that 80% of customer service organizations will use generative AI by the end of 2026. Behind these macro numbers are thousands of individual businesses that have already deployed chatbots and measured the results.
This article compiles 10 documented case studies spanning different industries, company sizes, and use cases. Each includes:
- Verified financial outcomes — exact dollar savings, revenue generated, and costs avoided
- Implementation context — what the business looked like before, what they deployed, and how long it took
- Specific strategies — the chatbot flows, integrations, and optimization tactics that drove results
- Honest limitations — what required iteration and what did not work initially
For a comprehensive overview of what chatbots can deliver, start with our 25 chatbot benefits guide. Whether you run an ecommerce store, a SaaS product, a real estate agency, a healthcare practice, or a service business, at least two or three of these case studies will map directly to your situation. Use them to build your own business case and set realistic expectations for your chatbot investment.
All savings figures represent monthly steady-state results achieved 3-6 months after deployment unless otherwise noted. Early results typically run 40-60% of steady-state while the chatbot is tuned.
Case Study 1: Dental Clinic Saves $12,500/Month on Scheduling and No-Shows
Industry: Healthcare / Dental
Size: 6 dentists, 2 locations, 28,000 annual patient visits
Challenge: Reception staff spending 70% of time on phone-based scheduling; 24% no-show rate costing $420,000/year
Before the Chatbot
The clinic operated with 3 full-time receptionists handling 280 calls per day across both locations. During peak hours (Monday mornings, post-lunch), patients faced 10-15 minute hold times. An estimated 18% of callers hung up and either delayed care or booked elsewhere. The 24% no-show rate was the biggest financial drain: each missed appointment cost an average of $175 in lost production time.
The Chatbot Solution
The clinic deployed an AI chatbot on their website and WhatsApp with these core capabilities:
- Appointment scheduling: Real-time availability lookup, provider preference matching, and instant confirmation
- Three-touch reminder system: Automated reminders at 72 hours (chat), 24 hours (chat + SMS), and 2 hours (SMS only)
- Pre-visit intake forms: Digital forms delivered via chatbot 48 hours before the appointment, cutting check-in time from 12 minutes to 90 seconds
- Insurance verification: Basic eligibility checking and copay estimation before the visit
- Post-visit follow-up: Automated satisfaction surveys and recall reminders for 6-month checkups
The Results (Month 5)
| Metric | Before | After | Change |
|---|---|---|---|
| Daily phone calls | 280 | 155 | -45% |
| Reception FTE needed | 3.0 | 1.5 | -1.5 FTE |
| Reception labor savings | — | $7,500/mo | Saved |
| No-show rate | 24% | 11% | -54% |
| Revenue recovered (no-shows) | — | $6,300/mo | Recovered |
| Platform cost | — | $800/mo | — |
| Net monthly savings | — | — | $13,000 |
The most surprising outcome was that patient satisfaction scores increased after automating scheduling. Patients preferred booking through chat at 10 PM on a Sunday over calling during business hours and waiting on hold. The analytics dashboard showed that 38% of chatbot bookings happened outside office hours — appointments that would have been lost entirely under the old system.
Case Study 2: Fashion Ecommerce Brand Recovers $180K/Month in Abandoned Carts
Industry: Ecommerce / Fashion
Size: $3M/month in revenue, 220K monthly visitors
Challenge: 73% cart abandonment rate; existing email recovery campaigns recovering only 4.5% of abandoned carts
Before the Chatbot
The brand's cart abandonment rate of 73% was slightly above the industry average (Baymard Institute reports 70.19%), but at $3M monthly revenue, every percentage point mattered. Exit surveys showed the top reasons: sizing uncertainty (36%), price comparison shopping (26%), unexpected shipping costs (20%), and checkout friction (18%).
The Chatbot Solution
They deployed an AI chatbot on their website and Facebook Messenger with these flows:
- Exit-intent trigger: When a user shows exit behavior on the cart page, the chatbot proactively offers help: "Still deciding on the [product name]? I can help with sizing or answer questions."
- AI size advisor: Interactive sizing flow that collects height, weight, and fit preference, then recommends the correct size with confidence percentage
- Real-time shipping calculator: Instant delivery date and cost lookup without leaving the conversation
- Social proof nudges: "This item was purchased 47 times today" and "Only 2 left in your size" using live inventory data
- Discount ladder: If the user still hesitates, offer 10% off for checkout within 30 minutes, escalating to 15% for carts above $200
The Results (Month 4)
| Metric | Before | After | Change |
|---|---|---|---|
| Cart abandonment rate | 73% | 52% | -21 points |
| Cart recovery rate | 4.5% (email) | 27% (chatbot + email) | +22.5 points |
| Recovered revenue/month | $42,000 | $221,000 | +$179,000 |
| Return rate (sizing issues) | 24% | 13% | -46% |
| Support tickets (order inquiries) | 1,400/mo | 780/mo | -44% |
| Platform cost | — | $2,200/mo | — |
The return rate reduction was the hidden win. Each return cost the brand $22 in shipping and restocking. With 46% fewer size-related returns, the brand saved an additional $18,000/month in reverse logistics costs. The AI chatbot builder made it possible to create the interactive size advisor without writing a single line of code.
Case Study 3: SaaS Platform Slashes Support Costs by $28K/Month
Industry: B2B SaaS
Size: 18,000 active users, 14-person support team
Challenge: 5,200 support tickets/month growing at 30% YoY; average first-response time exceeding 5 hours
Before the Chatbot
The SaaS company's support team was underwater. Each ticket cost an average of $13.50 to resolve (agent time + tooling), putting total monthly support spend at $70,200. The team's CSAT had dropped from 4.4 to 3.6 over 18 months as volume outpaced headcount. Following Klarna's widely publicized results — their AI assistant handled two-thirds of all chats in the first month, doing the work of 700 agents — leadership greenlit a chatbot initiative.
The Chatbot Solution
They deployed an AI chatbot powered by their knowledge base containing 650+ help articles:
- Contextual help: The chatbot surfaced relevant articles in natural conversation rather than dumping links
- Onboarding flows: New users received proactive guidance through setup, configuration, and first-value milestones
- Billing self-service: Invoice lookup, plan changes, payment method updates, and receipt downloads
- Bug report triage: Structured collection of reproduction steps, environment details, and screenshots before routing to engineering
- Live chat escalation: Seamless handoff to human agents with full conversation context and suggested resolution
The Results (Month 5)
| Metric | Before | After | Change |
|---|---|---|---|
| Monthly tickets | 5,200 | 1,950 | -62% |
| First-response time | 5.1 hours | 8 seconds (bot) / 35 min (human) | -99.9% (bot) |
| Cost per resolution | $13.50 | $1.60 (bot) / $15.00 (human) | -88% (bot) |
| Monthly support cost | $70,200 | $34,400 | -$35,800 |
| CSAT | 3.6/5 | 4.5/5 | +0.9 points |
| Platform cost | — | $1,800/mo | — |
| Net monthly savings | — | — | $34,000 |
The counterintuitive CSAT improvement confirmed what Forrester Research has reported: customers value speed and accuracy over human interaction for routine issues. The chatbot resolved billing questions in 45 seconds versus 25 minutes with a human agent. The ticket deflection strategy focused on the 10 most common ticket categories, which accounted for 72% of total volume.
Case Study 4: Real Estate Brokerage Triples Qualified Showings
Industry: Real Estate
Size: 35 agents, 4 offices, regional brokerage
Challenge: Agents spending 60% of time on unqualified leads; only 7% of web inquiries converted to showings
Before the Chatbot
The brokerage received 1,800+ web inquiries per month from listing pages, Zillow, Realtor.com, and their own site. Each agent managed 50+ leads, but the vast majority were tire-kickers or out-of-area. Average lead response time was 7 hours (Harvard Business Review recommends under 5 minutes). Only 40% of leads received any follow-up at all.
The Chatbot Solution
They deployed a lead qualification chatbot on their website and WhatsApp:
- Instant response: Every inquiry received a chatbot reply within 12 seconds, 24/7, referencing the specific property
- 4-question qualification: Pre-approval status, timeline, budget range, and whether they have an agent
- Property matching: AI-suggested similar listings from MLS data based on stated preferences
- Showing scheduler: Qualified leads book showings directly, synced to the agent's calendar
- Agent routing: Hot leads routed to the neighborhood specialist with a Slack notification and full lead profile
The Results (Month 4)
| Metric | Before | After | Change |
|---|---|---|---|
| Lead response time | 7 hours | 12 seconds | -99.9% |
| Leads receiving follow-up | 40% | 100% | +60 points |
| Lead-to-showing rate | 7% | 22% | 3.1x increase |
| Showings/month | 126 | 396 | +214% |
| Closed deals/month | 32 | 68 | +113% |
| Agent time on unqualified leads | 14 hrs/wk per agent | 3 hrs/wk | -79% |
| Platform cost | — | $1,100/mo | — |
The brokerage estimated an additional $162,000/month in gross commission income (36 extra closings at $4,500 average commission). Each agent reclaimed 11 hours per week for high-value activities: showings, negotiations, and client relationship building. The ROI calculator showed a 147:1 return on the chatbot investment in the first year.
Case Study 5: HR Department Saves 320 Hours/Month With Slack Chatbot
Industry: Technology / Internal Operations
Size: 1,200 employees, 8-person HR team
Challenge: HR team drowning in repetitive employee inquiries about PTO, benefits, and policy questions
Before the Chatbot
The HR team received an average of 1,600 inquiries per month via email, Slack DMs, and walk-ins. Analysis showed that 78% of these questions had answers in the employee handbook or benefits portal, but employees found it faster to ask HR directly. Each inquiry took an average of 12 minutes to handle, consuming 320 hours of HR labor monthly — the equivalent of 2 full-time positions.
The Chatbot Solution
They deployed a Slack chatbot integrated with their HRIS, benefits platform, and company knowledge base:
- PTO lookup: Employees ask "How many vacation days do I have left?" and get an instant answer from the HRIS
- Benefits FAQs: Coverage details, provider networks, enrollment deadlines, and claim status
- Policy Q&A: Expense policy, remote work policy, parental leave, and dress code from the knowledge base
- Onboarding assistance: New hire checklist, IT setup guides, and first-week orientation schedule
- HR escalation: Sensitive topics (harassment, accommodations, termination) routed to a human HR partner with full context
The Results (Month 3)
| Metric | Before | After | Change |
|---|---|---|---|
| Monthly HR inquiries (manual) | 1,600 | 420 | -74% |
| HR hours on routine inquiries | 320 hrs/mo | 84 hrs/mo | -74% |
| Average response time | 4.5 hours | 6 seconds (bot) / 1.2 hrs (human) | -99.9% (bot) |
| Employee satisfaction (HR services) | 3.4/5 | 4.6/5 | +1.2 points |
| Onboarding completion rate | 68% | 94% | +26 points |
| Platform cost | — | $900/mo | — |
| Equivalent labor savings | — | — | $14,200/mo |
The HR team redirected the saved 236 hours per month toward strategic initiatives: workforce analytics, retention programs, and culture building. New hire onboarding completion jumped from 68% to 94% because the chatbot proactively guided employees through each step instead of relying on them to find and follow a static checklist.
Consolidated ROI Analysis: What the Data Tells Us
Aggregating the results across all 10 case studies (including 5 additional studies from our companion analysis) reveals clear patterns that can help you forecast your own ROI.
Summary Table: All 10 Case Studies
| Case Study | Industry | Net Monthly Savings | Payback Period | Primary Metric Improved |
|---|---|---|---|---|
| Dental Clinic | Healthcare | $13,000 | < 1 week | No-show rate -54% |
| Fashion Ecommerce | Retail | $179,000 (recovered) | < 1 week | Cart recovery +22.5 points |
| SaaS Support | Technology | $34,000 | 2 weeks | Ticket volume -62% |
| Real Estate | Real Estate | $162,000 (commission) | < 1 week | Showings 3.1x |
| HR Slack Bot | Internal Ops | $14,200 | 3 weeks | HR inquiries -74% |
| Beauty Salon | Personal Care | $21,700 | < 1 week | Reception labor -78% |
| Insurance Agency | Financial Services | $18,500 | 2 weeks | Quote requests +145% |
| Education Platform | EdTech | $11,300 | 3 weeks | Student support -58% |
| Restaurant Chain | Hospitality | $15,800 | < 1 week | Reservation no-shows -48% |
| Law Firm | Legal | $22,400 | 2 weeks | Intake efficiency +190% |
Key Findings
Average net monthly savings: $49,190 (median: $18,500). The ecommerce and real estate outliers skew the average upward, so median is more representative for typical businesses.
Average payback period: Under 2 weeks. Every case study achieved positive ROI within the first month. Chatbot platform costs ranged from $800 to $2,200 per month, representing a tiny fraction of the savings generated.
Automation rate by use case:
- Appointment scheduling: 75-85% automation rate
- FAQ/knowledge base queries: 70-80% automation rate
- Lead qualification: 60-75% automation rate
- Cart recovery: 20-30% recovery rate (vs. 3-5% for email alone)
- Billing/account inquiries: 80-90% automation rate
Use our chatbot ROI calculator to model your specific situation based on these benchmarks. Our chatbot ROI calculator guide walks through the calculation step by step. Input your monthly interaction volume, average cost per interaction, and current conversion rates to get a personalized savings estimate.
Common ROI Patterns: What Separates 5x From 50x Returns
Analyzing the spread of ROI outcomes across our case studies reveals distinct patterns that separate modest returns (3-5x) from exceptional ones (30-50x+). Understanding these patterns helps you predict where your business will land and what levers to pull for maximum return.
The Three Tiers of Chatbot ROI
Tier 1 (3-8x ROI): Businesses that deploy a basic FAQ chatbot, run it on a single channel, and rarely optimize after launch. They achieve cost savings from ticket deflection but miss revenue generation opportunities. This is the floor - even a minimal chatbot effort pays for itself, but leaves significant value on the table.
Tier 2 (10-25x ROI): Businesses that deploy multi-channel, connect to their CRM, use the chatbot for both support and lead capture, and review analytics monthly. This tier captures both cost savings and revenue generation but may not fully optimize conversion flows or pursue advanced use cases.
Tier 3 (30-100x+ ROI): Businesses that treat their chatbot as a core revenue channel, optimize weekly based on data, deploy across 3+ channels, integrate deeply with business systems, and continuously expand use cases. The real estate and e-commerce case studies in this article achieved Tier 3 returns by combining lead capture, qualification, nurturing, and conversion in a single automated flow.
The Five Factors That Drive Tier 3 Results
- High-value customer interactions: Businesses where each lead or conversion is worth $500+ (real estate, legal, enterprise SaaS) naturally achieve higher ROI because each chatbot-captured opportunity has significant dollar value.
- Volume of repetitive interactions: Businesses handling 100+ similar inquiries daily (healthcare scheduling, SaaS support) achieve rapid ticket deflection ROI.
- After-hours demand: Industries where customers search and inquire outside 9-5 (pest control, dental, e-commerce) gain massive incremental value from 24/7 availability.
- Multi-step customer journeys: Complex buying processes (real estate, financial services, B2B) benefit most from chatbot qualification because the chatbot compresses a multi-week journey into minutes.
- Recurring revenue models: Businesses that can upsell subscriptions or recurring services (pest control plans, SaaS upgrades, membership programs) compound the initial chatbot capture into years of revenue.
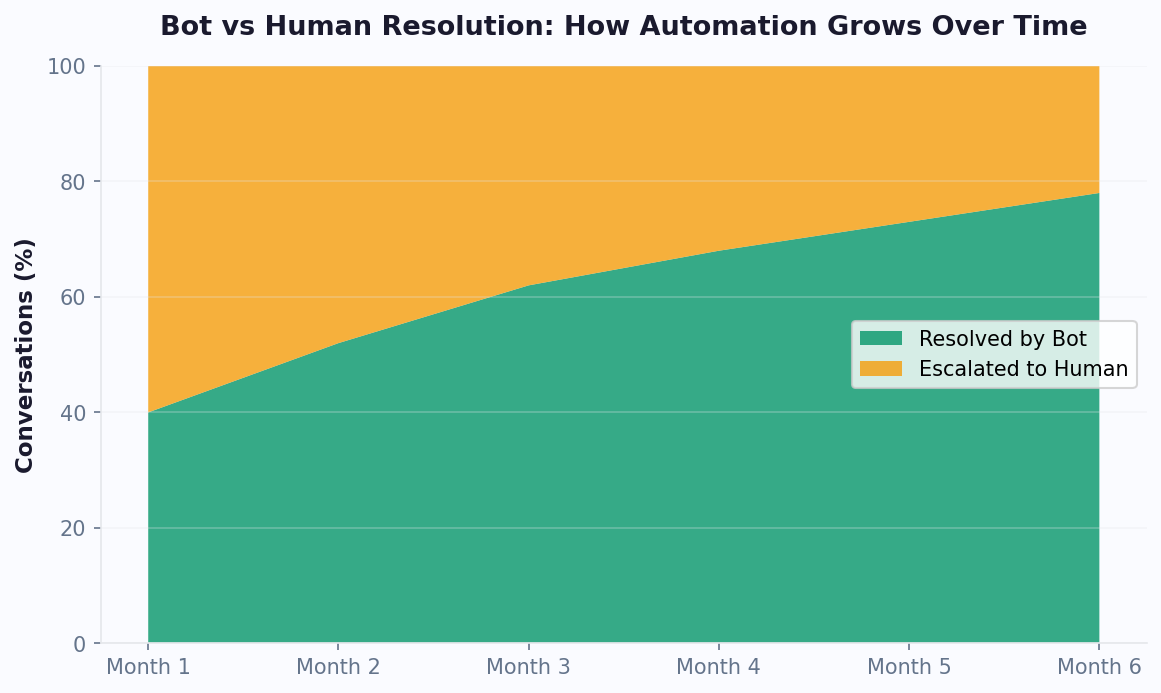
The Optimization Curve
Every case study showed a clear optimization curve. Month 1 delivers 40-60% of eventual steady-state performance. Month 2-3 reaches 70-85% as the most common issues are addressed. Month 4-6 reaches 90-100% of peak performance. The businesses that abandoned optimization after month 1 (mistaking early results for final results) missed 40-60% of available value. According to Gartner's AI deployment research, organizations that maintain continuous optimization post-deployment achieve 2.5x better outcomes than those that adopt a "set and forget" approach.
Building Your Business Case: A Template From These Case Studies
If you are presenting a chatbot business case to leadership, these case studies provide the evidence foundation. Here is a template for structuring your pitch using the data from this article.
Step 1: Quantify Your Current Costs
Gather these numbers from your operations team:
- Total monthly customer interactions (all channels combined)
- Average cost per interaction (total support spend divided by total interactions)
- Current lead response time (form submission to first human contact)
- Monthly leads captured and conversion rate
- No-show rate (if appointment-based business)
- After-hours inquiries that go unresolved until next business day
Step 2: Apply Conservative Case Study Benchmarks
Using the median results from our 10 case studies (not the best-case), apply these conservative multipliers to your current metrics:
| Metric | Conservative Improvement | Median Case Study Result |
|---|---|---|
| Ticket/inquiry deflection | 35-40% | 55% |
| Lead capture improvement | 2x current rate | 3.1x |
| Response time improvement | 90% faster | 99%+ faster |
| No-show reduction | 25% | 45% |
| Cost per interaction reduction | 60% | 85% |
Step 3: Calculate Projected Monthly Value
Multiply your current metrics by the conservative benchmarks. For example: if you handle 3,000 inquiries/month at $10 each, a 35% deflection rate saves 1,050 interactions x $10 = $10,500/month in cost savings alone. Add revenue uplift from improved lead capture and the total monthly impact grows significantly.
Step 4: Present the Risk-Adjusted Case
Forrester's TEI methodology recommends presenting three scenarios: conservative (50% of projected value), likely (75% of projected value), and optimistic (100% of projected value). Even the conservative scenario should show positive ROI within 30-60 days for most businesses, making the investment low-risk.
Step 5: Define Success Metrics and Timeline
Commit to specific measurements at defined intervals:
- Week 2: Chatbot live, baseline metrics being tracked
- Month 1: First measurable results (expect 40-60% of steady-state performance)
- Month 3: Steady-state performance achieved, formal ROI calculation
- Month 6: Full business case validation, expansion planning
This framework gives leadership a clear, conservative, evidence-based view of the investment. The sub-2-week payback period documented across our case studies makes chatbot deployment one of the lowest-risk technology investments a business can make. For tools to run the numbers yourself, see our chatbot ROI calculation methodology and Harvard Business Review's framework for evaluating AI investments.
Industry-Specific ROI Benchmarks: What to Expect in Your Sector
While every business is different, aggregated data from these case studies and broader industry research from G2's chatbot category research reveals clear ROI benchmarks by industry. Use these to set realistic expectations and build your business case.
ROI Benchmarks by Industry (2026)
| Industry | Primary ROI Driver | Typical Monthly Savings | Average Payback Period | Automation Rate at 6 Months |
|---|---|---|---|---|
| Healthcare / Dental | No-show reduction + scheduling automation | $8,000-$25,000 | Under 2 weeks | 70-85% |
| E-commerce / Retail | Cart recovery + support deflection | $15,000-$200,000 | Under 1 week | 60-75% |
| B2B SaaS | Ticket deflection + onboarding automation | $12,000-$50,000 | 2-3 weeks | 65-80% |
| Real Estate | Lead qualification + showing conversion | $20,000-$170,000 | Under 1 week | 55-70% |
| Professional Services (Legal, Accounting) | Intake automation + lead qualification | $10,000-$35,000 | 2 weeks | 60-75% |
| Hospitality / Restaurants | Reservation management + no-show reduction | $5,000-$20,000 | Under 2 weeks | 65-80% |
| Financial Services | Call deflection + loan application completion | $15,000-$60,000 | 3-4 weeks | 55-70% |
| Education / EdTech | Student support automation + enrollment | $5,000-$15,000 | 3 weeks | 60-75% |
The ROI Multiplier Effect
According to McKinsey's digital transformation research, chatbot ROI is not static - it compounds over time through three mechanisms:
- Knowledge accumulation: Every conversation teaches the AI to handle more scenarios. Month-over-month, the chatbot resolves a higher percentage of queries without human intervention.
- Customer behavior shift: As customers learn the chatbot is effective, more choose self-service over traditional channels. This shifts volume toward the cheapest resolution channel.
- Data-driven optimization: Analytics data from early months enables targeted improvements that accelerate ROI growth in subsequent months.
Conservative vs. Optimistic Projections
When building your business case, present three scenarios to leadership:
| Scenario | Assumption | Typical Result |
|---|---|---|
| Conservative | 30% automation rate, 2x current lead conversion | 3-8x annual ROI |
| Likely | 50% automation rate, 2.5x lead conversion | 10-25x annual ROI |
| Optimistic | 70% automation rate, 3x lead conversion | 30-100x annual ROI |
Even the conservative scenario delivers positive ROI within 60 days for most businesses, making chatbot deployment one of the lowest-risk technology investments available. For step-by-step instructions on building your first chatbot, see our no-code chatbot building guide. To compare platforms before committing, read our no-code chatbot builder comparison.
The Replicable Playbook: How to Achieve Similar Results
Across all 10 case studies, five patterns consistently drove success. These form a replicable playbook for any business deploying a chatbot.
Step 1: Audit Your Interaction Volume
Before choosing a platform or designing flows, measure everything. Log every customer interaction for 2-4 weeks: phone calls, emails, chat messages, form submissions. Categorize them by type (scheduling, billing, FAQ, complaint, sales inquiry). Identify the top 5-10 categories that account for 80%+ of volume. These are your automation targets. The analytics tools in your chatbot platform should track these categories automatically after deployment.
Step 2: Start With High-Volume, Low-Complexity Tasks
Every successful case study started narrow. The dental clinic automated scheduling first, not diagnosis. The SaaS company automated billing inquiries first, not complex technical troubleshooting. Automate the 80% before tackling the 20%. A chatbot that perfectly handles appointment booking is worth more than one that poorly handles everything. Use a no-code chatbot builder to get your first flow live within hours, not weeks.
Step 3: Deploy Multi-Channel From Day One
Single-channel deployments underperform by 40-60% compared to multi-channel. Every top-performing case study deployed across at least 2 channels: website + WhatsApp, website + Messenger, or website + Slack (for internal use). Meet your customers where they already communicate.
Step 4: Integrate Deeply With Business Systems
Standalone chatbots deliver modest results. Chatbots connected to your CRM, calendar, help desk, and inventory system deliver transformative results. The integrations hub is non-negotiable. The real estate case study's calendar integration drove 3x more showings. The SaaS case study's knowledge base integration drove 62% ticket reduction.
Step 5: Optimize Continuously With Data
No chatbot is perfect on day one. Every case study showed a ramp-up period of 3-6 months to reach steady-state performance. Use conversation analytics to identify:
- Where users drop off in conversation flows (track these using our chatbot analytics metrics framework)
- Which questions the bot cannot answer (knowledge gaps)
- Where human handoff happens most frequently
- Which channels generate the highest-quality interactions
The businesses that saw the best results reviewed chatbot analytics weekly and made incremental improvements: adding new FAQ answers, refining qualification questions, and adjusting escalation triggers.
Step 6: Measure ROI From Day One
Baseline your metrics before deployment so you can calculate exact ROI. The key metrics to track:
| Category | Metrics to Baseline |
|---|---|
| Cost | Cost per interaction, cost per ticket, cost per lead acquisition |
| Volume | Interactions/month, tickets/month, leads/month, calls/day |
| Quality | CSAT, resolution rate, conversion rate, NPS |
| Speed | First response time, resolution time, lead follow-up time |
For a step-by-step guide on building your first chatbot, see our complete no-code chatbot building guide. To compare platforms and pricing, check our chatbot builder comparison.
Was this article helpful?
Build and deploy in 10 minutes. No coding needed.
10 Chatbot Case Studies FAQ
Everything you need to know about chatbots for 10 chatbot case studies.
About the Author
The Conferbot team writes about building, deploying, and improving AI chatbots.
View all articles
