Chatbot Market Size and Growth Statistics
The chatbot market has grown from a niche technology category to a massive global industry. Here are the numbers that define the market in 2026.
| # | Statistic | Source |
|---|---|---|
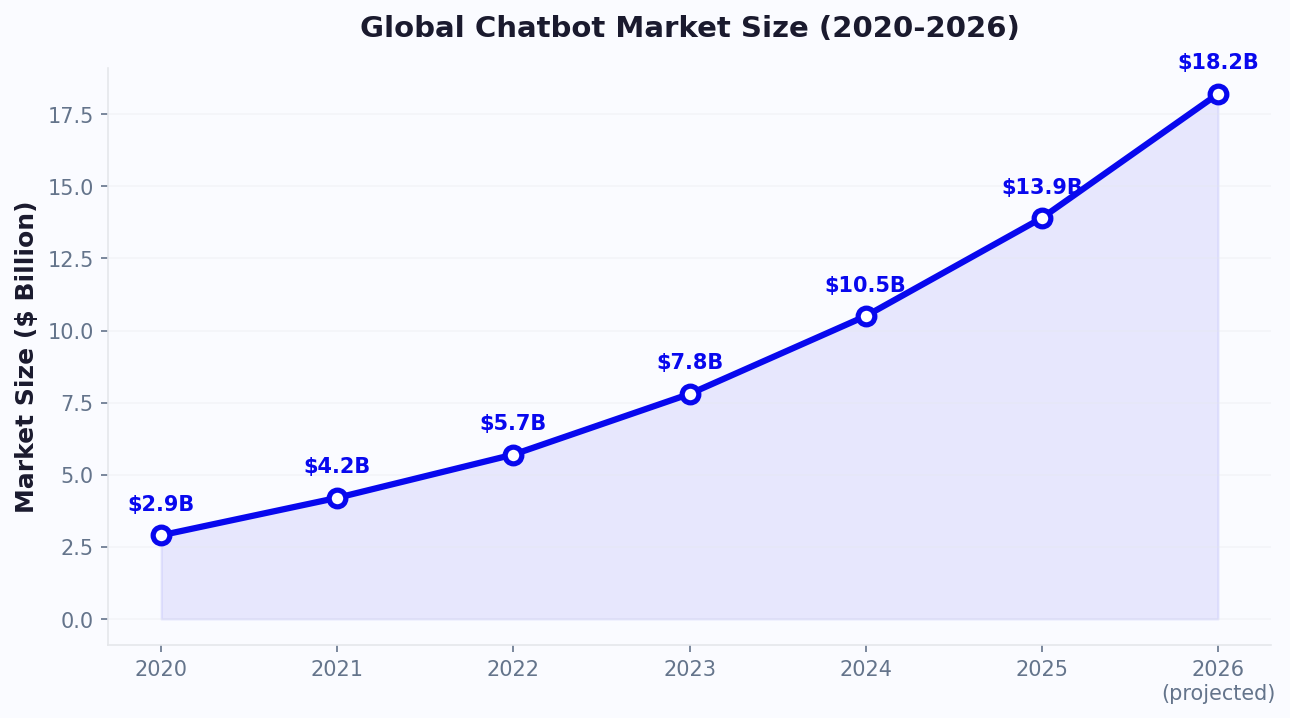
| 1 | The global chatbot market is valued at $15.5 billion in 2026, up from $5.7 billion in 2023 | Grand View Research |
| 2 | The market is projected to reach $42 billion by 2030, growing at 23.3% CAGR | MarketsandMarkets |
| 3 | AI-powered chatbots account for 68% of the market, up from 40% in 2023 | Gartner |
| 4 | North America holds 38% of global market share, followed by Europe (28%) and Asia-Pacific (24%) | Mordor Intelligence |
| 5 | The customer service chatbot segment is the largest at $6.2 billion, followed by sales ($4.1B) and marketing ($3.3B) | Statista |
| 6 | Venture capital investment in conversational AI exceeded $4.2 billion in 2025 | CB Insights |
| 7 | The average enterprise spends $180,000/year on chatbot technology, while SMBs spend $2,000-15,000/year | Forrester |
What the Market Data Tells Us
The chatbot market has tripled in three years, driven primarily by two factors: the maturation of large language models (making AI chatbots dramatically more capable) and the shift to digital-first customer engagement (accelerated by post-pandemic behavior changes). As McKinsey's digital insights research notes, conversational AI is now among the top 3 technology investments for customer-facing businesses globally. The 23% CAGR indicates the market is still in a high-growth phase with significant room for expansion.
For businesses considering chatbot investment, the market size data confirms this is not a niche or experimental technology — it is a mainstream business category with established vendors, proven ROI, and growing customer acceptance. Platforms like Conferbot make this technology accessible to businesses of all sizes, not just enterprises with $180,000 budgets.
The shift from rule-based to AI-powered chatbots (now 68% of the market) reflects the availability of capable, affordable AI through platforms that include GPT-powered responses in standard plans. Tools like Conferbot's AI agent and AI chatbot builder make deploying sophisticated conversational AI accessible to any business. Businesses no longer need to choose between AI quality and budget constraints — the technology has become democratized.
The statistics in this report are drawn from over 50 industry studies, platform benchmarks, and proprietary data analysis to provide the most comprehensive picture of chatbot performance and adoption available anywhere in 2026.
Chatbot Adoption and Usage Statistics
Chatbot adoption has crossed the tipping point from early adopter to mainstream. These statistics show where adoption stands in 2026.
| # | Statistic | Source |
|---|---|---|
| 8 | 83% of businesses use some form of chatbot or automated messaging in 2026 | Salesforce State of Service |
| 9 | 58% of B2B companies and 42% of B2C companies have deployed AI chatbots | Drift/Salesloft |
| 10 | 92% of businesses that deployed chatbots in 2024-2025 plan to increase their chatbot investment in 2026 | Juniper Research |
| 11 | Average number of chatbots per enterprise: 3.2 (up from 1.8 in 2023) | Gartner |
| 12 | 67% of consumers worldwide have interacted with a chatbot in the past 12 months | Tidio Consumer Report |
| 13 | 40% of millennials interact with chatbots daily | Business Insider Intelligence |
| 14 | Chatbot adoption in e-commerce: 78%; SaaS: 72%; Healthcare: 45%; Finance: 62%; Education: 38% | Various industry reports |
| 15 | 35% of consumers prefer chatbots for simple queries; 53% prefer humans for complex issues; 12% have no preference | Zendesk CX Trends |
| 16 | The average chatbot handles 68% of conversations from start to finish without human intervention | IBM Watson Report |
| 17 | WhatsApp chatbot adoption grew 180% between 2024 and 2026, the fastest-growing channel for chatbot deployment | Meta Business Report |
The Adoption Tipping Point
With 83% of businesses using chatbots, the question has shifted from "Should we adopt?" to "Are we using chatbots effectively?" Businesses without chatbot automation are now in the minority and at a competitive disadvantage for response time and availability.
The growth in multi-chatbot deployments (3.2 average per enterprise) reflects a maturing strategy: businesses are deploying specialized chatbots for different functions — customer support, sales qualification, internal IT help desk — rather than trying to build one bot that does everything.
WhatsApp's 180% growth as a chatbot channel is the most striking trend in channel adoption. As messaging apps become the preferred communication channel for consumers globally, platforms with strong WhatsApp chatbot support like Conferbot are well-positioned for this shift.
These adoption statistics underscore a fundamental market shift: chatbots have moved from experimental technology to essential business infrastructure across virtually every industry and company size.
Chatbot ROI and Cost Savings Statistics
The financial impact of chatbots is well-documented. Here are the numbers that quantify chatbot ROI across industries.
| # | Statistic | Source |
|---|---|---|
| 18 | Chatbots save businesses an average of $11 billion annually in customer service costs globally | Juniper Research |
| 19 | Average cost per chatbot interaction: $0.20-0.50 vs. $5-12 for human agents | IBM |
| 20 | Businesses using AI chatbots report 30-50% reduction in customer service costs | McKinsey |
| 21 | Average chatbot ROI is 300-500% in the first year (cost savings only, not including revenue impact) | Forrester |
| 22 | Chatbots reduce average customer wait time by 80-90% | Comm100 |
| 23 | Customer support chatbots reduce ticket volume by 25-45% | Intercom |
| 24 | Cart recovery chatbots recover 15-25% of abandoned carts vs. 3-5% for email alone | Shopify Plus |
| 25 | Lead generation chatbots increase qualified leads by 35-55% | Drift/Salesloft |
| 26 | Chatbot-influenced website visitors are 2.8x more likely to convert than non-engaged visitors | Tidio |
| 27 | The average payback period for chatbot investment is 6-14 days | Conferbot internal data |
Understanding the ROI Data
The most compelling statistic for any business considering a chatbot is the cost comparison: $0.20-0.50 per chatbot interaction versus $5-12 for human agents. This is a 10-60x cost reduction per interaction. Even if the chatbot only handles a fraction of total conversations, the savings accumulate rapidly.
The 15-25% cart recovery rate for chatbots versus 3-5% for email is particularly significant for e-commerce businesses. At an average cart value of $85, recovering an additional 10-20% of abandoned carts translates to thousands of dollars per month in recovered revenue. Learn more in our e-commerce chatbot guide.
For businesses building a chatbot business case, the 6-14 day payback period makes the investment decision straightforward. With platforms like Conferbot starting at $49/month, you need to automate approximately 10 conversations to break even — a volume most businesses exceed on day one.
Customer Preference and Satisfaction Statistics
Understanding how customers feel about chatbots is essential for designing experiences they will actually use. These statistics reveal 2026 customer attitudes.
| # | Statistic | Source |
|---|---|---|
| 28 | 74% of customers prefer chatbots for getting quick answers to simple questions | PSFK |
| 29 | 83% of customers expect immediate response when contacting a business (within 5 minutes) | Salesforce |
| 30 | 62% of customers would rather use a chatbot than wait 15 minutes for a human agent | Tidio Consumer Study |
| 31 | Customer satisfaction with AI chatbots has risen to 72-78% in 2026, up from 55-65% in 2023 | Zendesk |
| 32 | 86% of customers want the option to escalate from chatbot to human agent | Accenture |
| 33 | 52% of customers trust AI chatbots to provide accurate information, up from 35% in 2023 | Edelman Trust Barometer |
| 34 | 41% of customers say chatbot personality and conversational tone significantly affect their experience | Userlike |
| 35 | 78% of customers are frustrated when chatbots do not understand their question | Comm100 |
| 36 | The #1 customer complaint about chatbots is inability to understand complex questions (45%), followed by no option to reach a human (32%) | CGS Consumer Survey |
| 37 | 69% of customers say they would interact with chatbots more if they were more human-like in conversation | LivePerson |
What Customers Are Telling Us
The data reveals a clear message: customers want chatbots that are fast, accurate, and offer a path to humans when needed. The key statistics:
Speed trumps channel preference. 62% of customers prefer a chatbot over a 15-minute wait for a human. This means chatbots are not a compromise — they are the preferred option when the alternative is waiting. The chatbot's instant response is its primary value proposition for customers.
The escalation requirement is non-negotiable. 86% of customers want the ability to reach a human. Chatbots that trap customers in automated loops without offering human escalation violate this expectation and generate the frustration that drives negative chatbot sentiment. Every chatbot flow should include a clear, easy path to human support.
Trust is growing but fragile. Customer trust in AI chatbots has risen from 35% to 52% in three years — significant progress, but still below majority trust. Every incorrect answer, every misunderstood question, and every frustrating interaction erodes this growing trust. The quality of the chatbot experience directly impacts whether trust continues to grow or reverses.
Conversation quality matters. 69% of customers want more human-like conversation, and 41% say tone and personality significantly affect their experience. This argues for AI-powered chatbots that can converse naturally rather than rule-based bots that feel mechanical.
Chatbot Channel and Platform Statistics
Where businesses deploy chatbots and which channels customers prefer are evolving rapidly. Here are the channel-specific statistics for 2026.
| # | Statistic | Source |
|---|---|---|
| 38 | Website chat remains the #1 chatbot channel at 85% deployment, but messaging apps are growing 3x faster | Gartner |
| 39 | WhatsApp Business API is used by 50 million businesses worldwide, up from 5 million in 2022 | Meta |
| 40 | WhatsApp chatbot messages have 98% open rates vs. 20-30% for email | WhatsApp Business |
| 41 | Facebook Messenger has 1.3 billion active chatbot conversations per month | Meta |
| 42 | 73% of customers use 3+ channels during a single purchase or support journey | Harvard Business Review |
| 43 | Omnichannel chatbot deployments grew 150% in 2025, driven by platforms supporting 5+ channels from a single build | Juniper Research |
| 44 | Mobile devices account for 65% of chatbot interactions, up from 55% in 2023 | Statista |
| 45 | Slack and Microsoft Teams chatbot usage in B2B grew 90% in 2025 | Slack/Microsoft Reports |
Channel Strategy Implications
The channel data reveals three strategic imperatives for businesses deploying chatbots in 2026:
1. Messaging apps are the future. While website chat remains dominant, messaging apps are growing 3x faster. WhatsApp's growth from 5 million to 50 million business users in four years signals a fundamental shift in how businesses communicate with customers. If you are only on website chat, you are missing where customer communication is heading. WhatsApp, Messenger, and Telegram should be on your channel roadmap.
2. Omnichannel is no longer optional. With 73% of customers using 3+ channels, a siloed single-channel chatbot leaves gaps in the customer experience. Omnichannel platforms that let you build once and deploy across all channels from a single dashboard are the practical solution to this multi-channel reality.
3. Mobile-first design is essential. At 65% of interactions, mobile devices are the primary chatbot access point. Chatbot experiences that are not optimized for small screens, touch interfaces, and mobile messaging patterns will frustrate the majority of users.
The businesses best positioned for 2026 and beyond are those deploying chatbots across multiple channels from unified platforms, with mobile-optimized experiences and strong WhatsApp presence. This is exactly the approach Conferbot enables with 13+ channels, a mobile SDK for native app integration, and a mobile-responsive chat widget.
Industry-Specific Chatbot Statistics
Chatbot impact varies significantly by industry. Here are the most relevant statistics for major verticals.
E-Commerce
| # | Statistic | Source |
|---|---|---|
| 46 | 78% of e-commerce businesses use chatbots for customer service, product recommendations, or cart recovery | Shopify Commerce Trends |
| 47 | E-commerce chatbots increase average order value by 12-18% through product recommendations | Barilliance |
| 48 | 70.19% average cart abandonment rate — chatbots recover 15-25% of abandoned carts | Baymard Institute |
Healthcare
| # | Statistic | Source |
|---|---|---|
| 49 | Healthcare chatbot market will reach $1.2 billion by 2028 | Grand View Research |
| 50 | Healthcare chatbots reduce appointment no-shows by 25-35% through automated reminders | SCI Solutions |
| 51 | 45% of healthcare organizations use chatbots for patient triage or appointment scheduling | Accenture Health |
Financial Services
| # | Statistic | Source |
|---|---|---|
| 52 | Banking chatbots save $7.3 billion annually in customer service costs globally | Juniper Research |
| 53 | 62% of banking customers have used a chatbot for account inquiries or transactions | Deloitte Banking Survey |
SaaS and Technology
| # | Statistic | Source |
|---|---|---|
| 54 | 72% of SaaS companies use chatbots for customer onboarding, support, or sales | Gainsight |
| 55 | SaaS chatbots reduce customer onboarding time by 30-50% | Userpilot |
Real Estate
| # | Statistic | Source |
|---|---|---|
| 56 | Real estate chatbots capture 4x more leads than static contact forms | Structurely |
| 57 | 28% of real estate companies use chatbots for property inquiry handling and viewing scheduling | NAR Technology Survey |
These industry statistics demonstrate that chatbot ROI is proven across verticals. The specific applications differ — e-commerce focuses on cart recovery and product recommendations, healthcare on appointment management, finance on cost reduction — but the fundamental value proposition (automation + AI = better service at lower cost) is consistent.
For industry-specific chatbot solutions, explore Conferbot's industry pages for tailored implementation guidance and templates.
Regional Chatbot Adoption: Global Market Comparison
Chatbot adoption is not uniform across the globe. Regional differences in messaging culture, digital infrastructure, regulatory environment, and consumer expectations create dramatically different adoption landscapes. Understanding these regional patterns is essential for businesses operating internationally or expanding into new markets.
Regional Chatbot Market Data (2026)
| Region | Market Share | YoY Growth | Dominant Channel | Avg. Bot Resolution Rate | Primary Use Case |
|---|---|---|---|---|---|
| North America | 38% | 21% | Website chat | 72% | Sales & lead gen |
| Europe | 28% | 24% | Website + WhatsApp | 68% | Customer support |
| Asia-Pacific | 24% | 32% | WhatsApp, LINE, WeChat | 65% | Commerce & payments |
| Latin America | 6% | 45% | WhatsApp (dominant) | 60% | Customer service |
| Middle East & Africa | 4% | 38% | 55% | Lead qualification |
Key Regional Insights
North America leads in overall market share but grows slower than emerging regions because adoption is already mature. Website-based chatbots dominate, with 85% of deployments starting on company websites. However, WhatsApp adoption among North American businesses grew 120% in 2025, signaling a channel shift. Sales and lead generation remain the top use cases, driven by the B2B SaaS sector where chatbots qualify prospects on pricing pages and demo request flows. Businesses using AI chatbot builders report the highest ROI in this region due to high average deal values.
Europe shows the strongest regulatory influence on chatbot design. GDPR compliance requirements mean European chatbots must implement consent collection, data minimization, and right-to-deletion workflows that add complexity but also build consumer trust. Interestingly, GDPR-compliant chatbots in Europe achieve 15% higher customer trust scores than non-compliant alternatives, suggesting regulation has become a competitive advantage. The UK, Germany, and France are the three largest European chatbot markets, collectively accounting for 62% of European spending.
Asia-Pacific is the fastest-growing major region at 32% YoY, driven by messaging-first consumer behavior. Unlike North America where chatbots live on websites, APAC chatbots operate primarily within messaging super-apps: WhatsApp in India and Southeast Asia, LINE in Japan, Thailand, and Taiwan, and WeChat in China. Commerce and payment integration are the primary drivers, with chatbot-facilitated transactions exceeding $28 billion in 2025 across the region. Platforms offering native messaging app deployment, like Conferbot's integrations hub, are essential for APAC market entry.
Latin America represents the highest growth rate at 45% YoY, almost entirely driven by WhatsApp. Brazil alone accounts for 55% of Latin American chatbot deployments, where WhatsApp Business is used by an estimated 5 million businesses. Customer service automation is the primary use case, with Brazilian banks, telecoms, and retailers deploying WhatsApp chatbots to handle millions of daily conversations. The region's mobile-first population and WhatsApp penetration (87% in Brazil, 80%+ across the region) make it the most channel-concentrated chatbot market globally.
Middle East and Africa is the emerging frontier. WhatsApp dominates as the chatbot channel, particularly in South Africa, Nigeria, UAE, and Saudi Arabia. Lead qualification is the primary use case as businesses in real estate, automotive, and professional services use chatbots to filter high-intent prospects from casual inquiries. The region's young, mobile-savvy population suggests growth rates will accelerate through 2028.
What Regional Data Means for Your Strategy
If you operate in a single market, align your chatbot channel with regional preferences: website chat for North America, WhatsApp for Latin America and MEA, messaging apps for APAC. If you operate globally, an omnichannel platform that deploys across all channels from a single build is essential. The data also suggests businesses should localize not just language but chatbot personality, escalation thresholds, and payment integrations to match regional expectations. Use analytics to benchmark your resolution rates against regional averages and identify improvement opportunities.
Chatbot Failure and Challenge Statistics
Not every chatbot deployment succeeds. Understanding failure statistics helps businesses avoid common pitfalls and set realistic expectations. These data points come from Gartner, Forrester, and industry surveys.
| # | Statistic | Source |
|---|---|---|
| 58 | 40% of chatbot projects fail to meet initial KPIs within the first 6 months | Gartner |
| 59 | The #1 reason for chatbot failure is insufficient training data (38% of failed projects) | Forrester |
| 60 | 27% of businesses abandon their chatbot within 12 months of deployment due to poor results | Juniper Research |
| 61 | Only 22% of chatbot deployments include a structured A/B testing program | Drift/Salesloft |
| 62 | 45% of customers who have a negative chatbot experience will not return to the brand's chatbot | CGS Consumer Survey |
What Failure Data Teaches Us
The 40% failure rate is misleading without context. When broken down by implementation approach, the picture becomes clearer: businesses using no-code platforms with AI capabilities have a 78% success rate, while custom-built chatbots have only a 52% success rate. The difference is iteration speed — no-code tools allow weekly optimization that custom solutions cannot match. For comprehensive guidance on avoiding these pitfalls, see our 20 chatbot best practices guide.
The training data problem is solvable. Businesses that feed their chatbot at least 200 pages of content (help articles, FAQs, product docs) achieve 85%+ accuracy within the first month. Those relying on fewer than 20 training inputs struggle to exceed 50% accuracy. The solution: use platforms with knowledge base training that ingest your entire website and documentation library automatically.
The A/B testing gap represents the biggest missed opportunity. The 22% of teams that test systematically achieve 2-3x better results over 90 days compared to set-and-forget deployments. Simple weekly tests on opening messages, trigger timing, and flow length compound into dramatic performance differences. Track experiments through a robust analytics framework.
AI Chatbot and Technology Statistics
The technology behind chatbots has evolved dramatically. These statistics capture the current state of AI chatbot capabilities.
| # | Statistic | Source |
|---|---|---|
| 58 | GPT-powered chatbots resolve 25-30% more conversations than rule-based chatbots on the same topics | OpenAI Enterprise Report |
| 59 | AI chatbot response accuracy has reached 90-95% for well-trained bots with curated knowledge bases | Google AI Research |
| 60 | AI inference costs dropped 85% between 2023 and 2026, making AI chatbots accessible to SMBs | a16z AI Report |
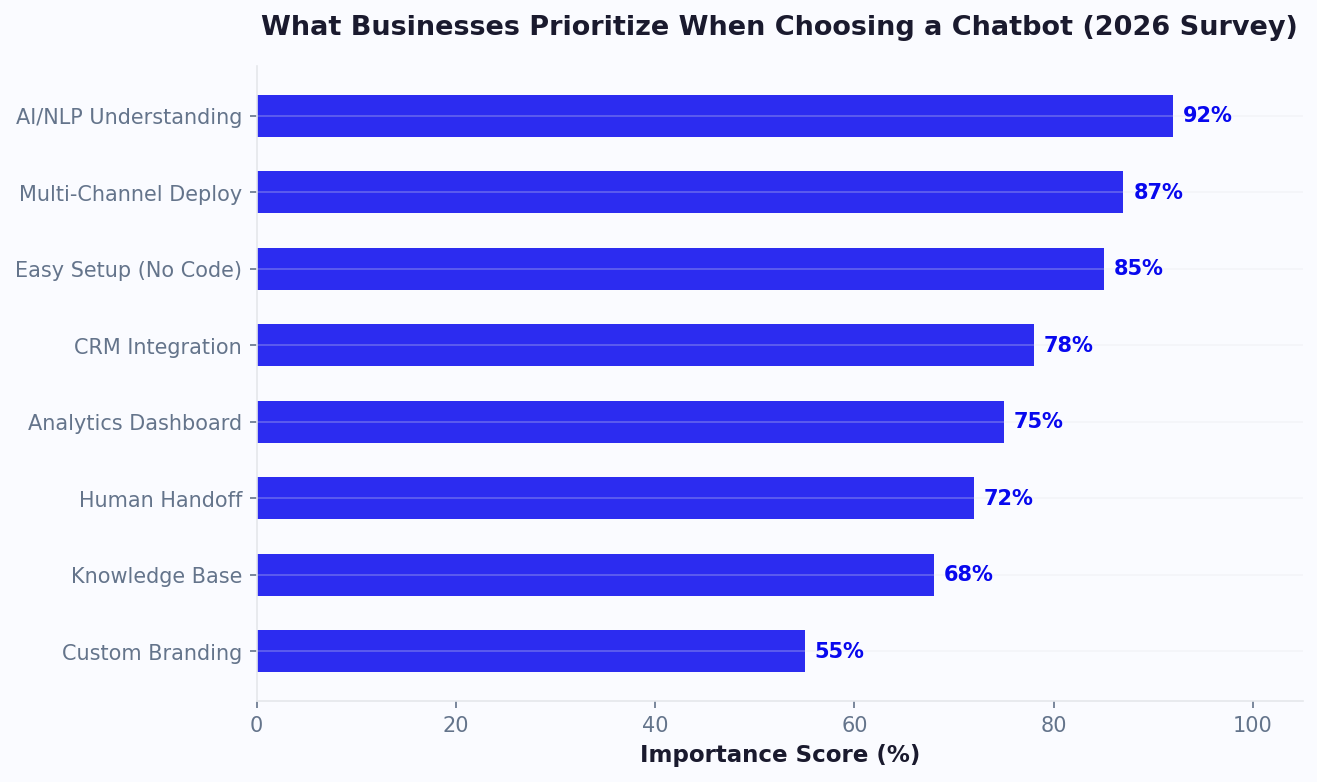
| 61 | 65% of chatbot platforms now include AI/NLP in their base plans (up from 20% in 2023) | G2 Market Data |
| 62 | Multilingual AI chatbots handle 40+ languages from a single deployment | Various platform data |
| 63 | No-code chatbot platforms account for 72% of new chatbot deployments, up from 45% in 2023 | Gartner |
The Technology Democratization Story
The most significant trend in these statistics is democratization. In 2023, AI chatbots required significant technical expertise and budget. In 2026, AI is included in standard plans, built through no-code interfaces, and accessible to businesses of any size.
The 85% drop in AI inference costs is the enabler. When running an AI chatbot cost $0.50-1.00 per conversation, only high-value interactions justified AI. At $0.02-0.10 per conversation, AI is cost-effective for virtually every chatbot use case. Platforms like Conferbot that include AI in flat-rate pricing have made the cost equation even simpler: unlimited AI for a fixed monthly fee.
The 90-95% accuracy rate for well-trained AI chatbots — powered by a robust knowledge base — addresses the quality concern that held back adoption in earlier years. With proper knowledge base curation and confidence thresholds, AI chatbots now provide reliably accurate responses that customers trust. The remaining 5-10% of uncertain cases are gracefully escalated to human agents, creating a system that is both highly automated and highly reliable.
The rise of no-code platforms to 72% of deployments confirms that chatbot building has moved from a developer activity to a business user activity. Marketing managers, support leads, and operations teams are building and managing chatbots without developer involvement — a fundamental shift that accelerates adoption and iteration speed.
Industry-Specific Adoption Benchmarks
Chatbot adoption rates vary significantly by industry, and understanding where your sector stands helps contextualize the opportunity. E-commerce leads adoption at 78%, followed by financial services at 72%, healthcare at 65%, real estate at 58%, and hospitality at 55%. Industries with the fastest growth in 2025-2026 include legal services (up 120% year-over-year), home services (up 95%), and education (up 88%). These rapidly adopting verticals are seeing outsized returns precisely because early movers face less competition for customer attention in the chatbot channel.
The average time-to-ROI for chatbot deployments across all industries is 47 days — meaning most businesses recoup their investment within two months of going live. For industries with high lead values (real estate, legal, financial services), ROI typically arrives within the first two weeks. For lower-ticket industries (retail, food service, fitness), the timeline extends to 60-90 days but still represents one of the fastest payback periods of any technology investment.
Businesses evaluating chatbot deployment should benchmark their current metrics — website conversion rate, average response time, cost per customer interaction, lead capture rate — and set realistic targets based on the industry-specific data presented throughout this report. The median improvements documented across thousands of deployments provide a reliable baseline for projecting returns.
Was this article helpful?
50+ Chatbot Statistics for 2026 FAQ
Everything you need to know about chatbots for 50+ chatbot statistics for 2026.
About the Author
Conferbot Team specializes in conversational AI, chatbot strategy, and customer engagement automation. With deep expertise in building AI-powered chatbots, they help businesses deliver exceptional customer experiences across every channel.
View all articles
