Why Internal Chatbot ROI Matters More Than Ever in 2026
Every enterprise spends between 15% and 30% of its operating budget on internal support functions, a range consistent with industry benchmarks: HR answering benefits questions, IT resetting passwords, Finance explaining expense policies, and Operations coordinating facility requests. Most of these interactions are repetitive, predictable, and low-complexity. They are also expensive when handled by humans who could be doing higher-value work.
Internal chatbots can take many of these routine employee queries off your team's plate. But getting budget approval requires more than anecdotes. You need a rigorous, defensible ROI calculation that your CFO will trust.
The challenge is that most ROI calculations for chatbot deployments are incomplete. They account for the obvious savings (fewer support tickets handled by humans) but miss critical factors: the cost of employee wait time, the productivity loss when knowledge workers spend time on support tasks, the impact on employee satisfaction and retention, and the compounding savings as the chatbot improves over time. An incomplete ROI calculation undervalues the investment and can lead to budget decisions that leave substantial savings on the table.
This guide provides a comprehensive, step-by-step framework for calculating the true ROI of an internal chatbot. We will walk through every cost input, every savings category, and every hidden factor that affects the final number. We will provide department-specific benchmarks for HR, IT, Finance, and Operations. We will show you how to calculate your payback period and present a compelling business case to leadership. And we will share the common mistakes that lead to inaccurate projections so you can avoid them.
Whether you are building a business case for your first internal chatbot or justifying the expansion of an existing deployment, these calculations will give you the numbers you need to make a confident, data-backed decision.
The Complete Internal Chatbot ROI Formula: Every Input Explained
The fundamental ROI formula for an internal chatbot is straightforward, but the devil is in the details, and SHRM benchmarking data places fully loaded cost per HR inquiry at $25-45. Here is the complete formula with every component explained.
Core ROI Formula
ROI = ((Total Annual Savings - Total Annual Cost) / Total Annual Cost) x 100
This gives you a percentage return on your chatbot investment. An ROI of 300% means that for every dollar you spend on the chatbot, you save three dollars. But to calculate this accurately, you need to understand both sides of the equation in detail.
Step 1: Calculate Your Current Support Costs (The Baseline)
Before you can measure savings, you need to know what you are currently spending on internal support. Here are the inputs you need to gather:
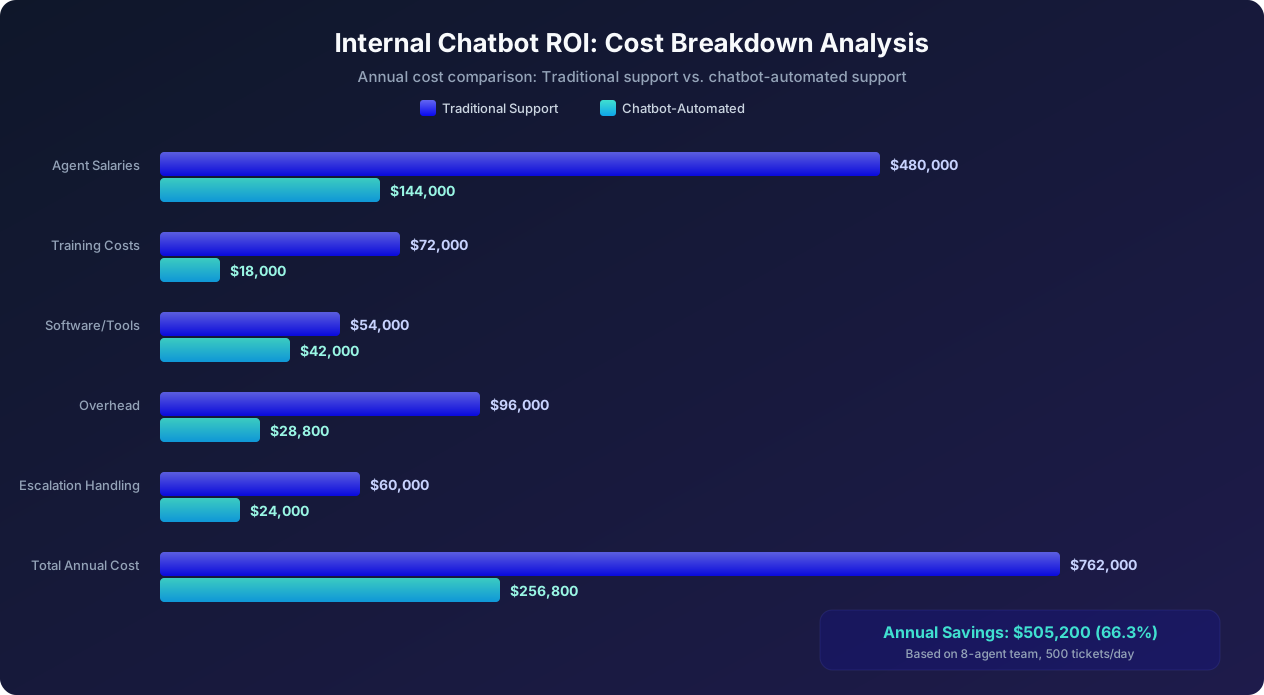
1. Support Agent Fully Loaded Cost: This is not just salary. Include benefits (typically 25-35% of salary), payroll taxes (7.65% FICA), office space allocation, equipment, and management overhead. For a support agent earning $55,000 base salary, the fully loaded cost is typically $75,000 to $85,000. For a mid-level IT support specialist, expect $80,000 to $100,000 fully loaded.
2. Total Tickets Per Day: Count all internal support requests across all channels: email, Slack messages, walk-ups, phone calls, and existing ticketing systems. Most organizations undercount by 30-40% because informal channels (Slack DMs, hallway questions) go untracked. Survey your support team for one week to get accurate numbers. A typical 500-employee company generates 80-150 internal support tickets per day across all departments.
3. Average Handle Time (AHT): Measure the total time from when an agent picks up a ticket to when it is fully resolved. Include research time, response drafting, follow-up messages, and documentation. For internal support, typical AHTs are: password resets (8-15 minutes), benefits questions (12-20 minutes), IT troubleshooting (15-30 minutes), policy inquiries (10-18 minutes), and onboarding guidance (20-45 minutes). Calculate a weighted average based on your ticket mix.
4. Number of Support FTEs: Count the full-time equivalent employees dedicated to internal support. This includes dedicated helpdesk staff, HR generalists who handle employee queries, IT support specialists, and the percentage of time that managers and senior staff spend answering repetitive questions from their teams. Many organizations find that managers spend 8-12 hours per week on questions that a chatbot could handle.
5. Software and Tool Costs: Total the annual cost of your current support tools: ticketing systems (ServiceNow, Zendesk, Jira Service Management), knowledge base platforms, phone systems, and any other tools your support team uses. These costs do not disappear entirely with a chatbot, but they often decrease as ticket volume drops.
Step 2: Determine Your Chatbot Deflection Rate
The deflection rate is the percentage of incoming queries that the chatbot resolves without human intervention. This is the single most important variable in your ROI calculation. Conservative estimates for a well-built internal chatbot:
| Query Type | Deflection Rate (Month 1) | Deflection Rate (Month 6) | Deflection Rate (Month 12) |
|---|---|---|---|
| Password resets and account unlocks | 85% | 92% | 95% |
| PTO balance and leave requests | 80% | 88% | 92% |
| Benefits FAQ and enrollment | 65% | 78% | 85% |
| IT troubleshooting (common issues) | 55% | 72% | 80% |
| Policy and procedure questions | 70% | 82% | 88% |
| Onboarding guidance | 60% | 75% | 82% |
| Expense report help | 72% | 84% | 90% |
| Facility and office requests | 50% | 68% | 76% |
Use the Month 6 rates for your first-year ROI calculation as they represent the average performance across the year. The improvement from Month 1 to Month 12 comes from the chatbot learning from interactions, expanding its knowledge base, and IT teams adding more automation workflows. For a detailed look at how IT chatbots handle these deflections, see our guide on AI chatbots for internal IT helpdesk.
Calculating Total Annual Savings: A Worked Example with Real Numbers
Let us walk through a complete savings calculation for a mid-size company (500 employees) with a combined internal support team of 8 FTEs across HR, IT, and Operations.
Baseline Assumptions
- Total internal support tickets: 120 per day (600 per week)
- Average handle time: 14 minutes per ticket
- Support agent fully loaded cost: $80,000 per year
- Number of support FTEs: 8
- Working days per year: 250
- Chatbot deflection rate (Year 1 average): 68%
Direct Cost Savings
1. Agent Time Savings:
Tickets deflected per day: 120 x 0.68 = 81.6 tickets
Time saved per day: 81.6 x 14 minutes = 1,142 minutes = 19.04 hours
Time saved per year: 19.04 x 250 = 4,760 hours
Cost per agent hour: $80,000 / 2,000 hours = $40/hour
Annual agent time savings: 4,760 x $40 = $190,400
2. Reduced Staffing Requirement:
With high deflection, your 8-person team effectively has the capacity of a 2.56-person team for the remaining 32% of tickets. You may not eliminate 5.44 positions immediately, but you can avoid hiring as the company grows, reassign staff to higher-value work, or reduce headcount through natural attrition. For the ROI calculation, count the avoided hiring cost for at least 2 positions over 3 years: 2 x $80,000 = $160,000/year in avoided costs.
3. Employee Productivity Recovery:
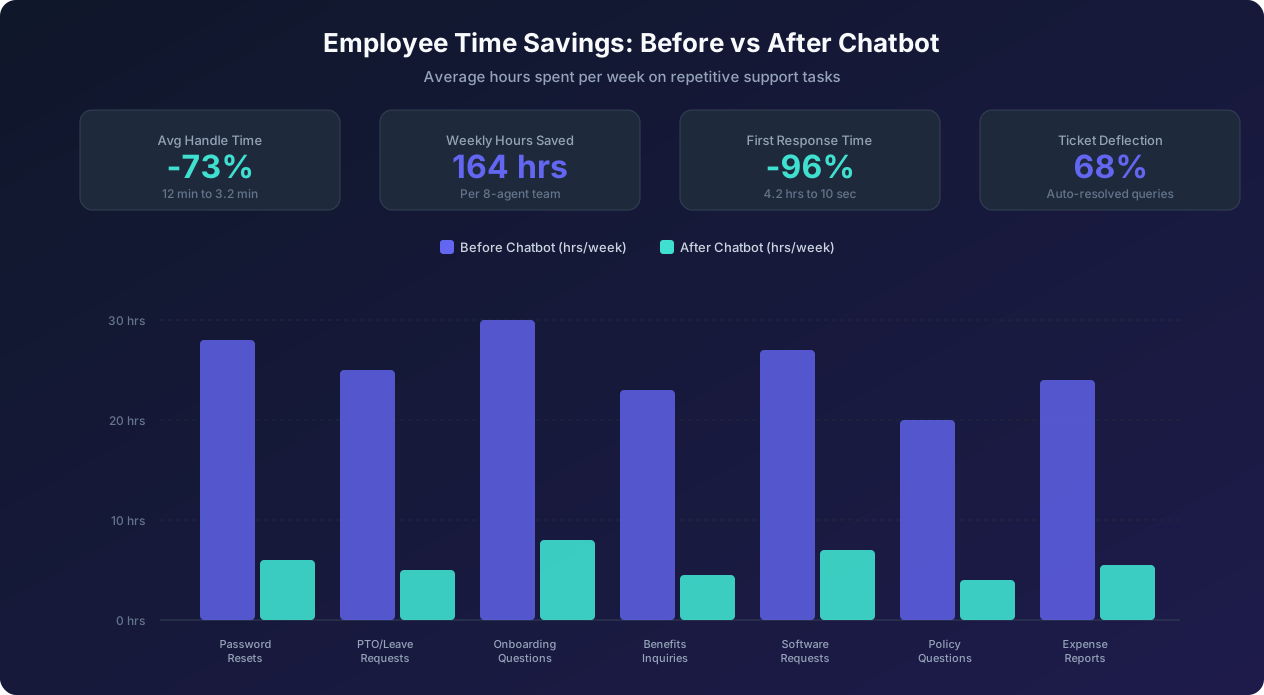
Employees waiting for support answers lose productive time. Average wait time for an internal support response is 4.2 hours (Zendesk benchmark data). With a chatbot providing instant answers to 68% of queries, employees recover that wait time:
Tickets deflected per year: 81.6 x 250 = 20,400
Recovered wait hours: 20,400 x 4.2 hours = 85,680 employee-hours
Average employee cost per hour: $45 (knowledge worker median)
But not all wait time is entirely unproductive, so apply a 30% productivity factor:
Productivity recovery value: 85,680 x $45 x 0.30 = $1,156,680
This is a significant number, and skeptical CFOs will discount it heavily. For a conservative business case, use a 15% productivity factor instead: $578,340. For the most conservative case, exclude this line item entirely and rely on direct cost savings only.
4. Training Cost Reduction:
Internal support teams have 30-40% annual turnover. With 8 FTEs and 35% turnover, you hire approximately 2.8 replacements per year. Each new hire requires 3-6 weeks of training. Chatbot reduces training needs because: fewer agents need to be hired, and the chatbot serves as a training tool for remaining agents (instant access to institutional knowledge). Estimated training savings: $36,000/year (2 fewer hires x $18,000 training cost each).
Total Direct Savings Summary
| Savings Category | Conservative | Moderate | Optimistic |
|---|---|---|---|
| Agent time savings | $190,400 | $190,400 | $190,400 |
| Avoided hiring | $80,000 | $160,000 | $240,000 |
| Employee productivity recovery | $0 | $578,340 | $1,156,680 |
| Training cost reduction | $36,000 | $36,000 | $36,000 |
| Total Annual Savings | $306,400 | $964,740 | $1,623,080 |
For the executive business case, present the moderate scenario as your primary projection with conservative as the floor. This approach builds credibility and gives leadership confidence that even the worst-case outcome delivers strong returns. For context on how employee self-service bots drive these savings in practice, review our employee FAQ bot guide.
Department-Specific ROI: Benchmarks for HR, IT, Finance, and Operations
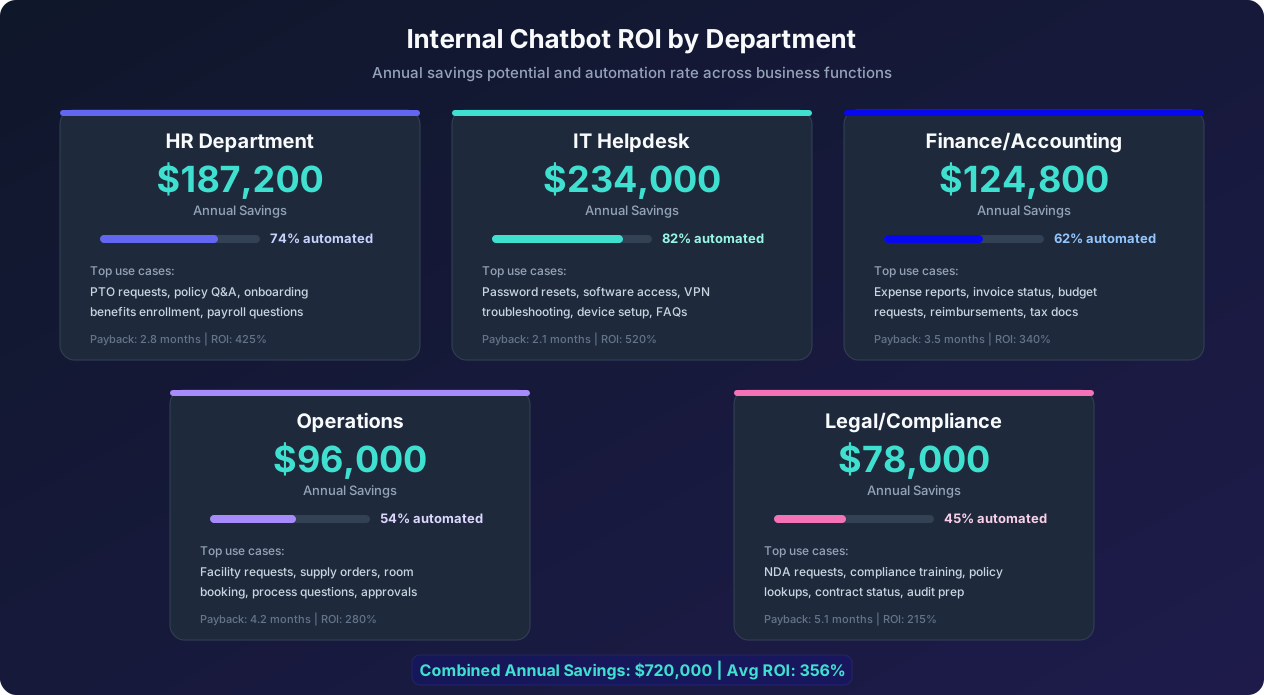
Different departments see different ROI profiles, as Deloitte's Human Capital Trends report confirms because their query types, volumes, and complexity levels vary significantly. Here are detailed benchmarks for each major department.
HR Department
HR chatbots consistently deliver the fastest payback because HR queries are high-volume, highly repetitive, and well-documented in existing policies. The top HR chatbot use cases by savings impact:
- PTO and leave management: Employees check balances, submit requests, and get approval status. Automation rate: 90%. Per-query savings: $12. Annual volume (500 employees): 6,000 queries. Annual savings: $64,800.
- Benefits enrollment and FAQ: Open enrollment questions, coverage details, provider lookups. Automation rate: 78%. Per-query savings: $18. Annual volume: 3,500 queries. Annual savings: $49,140.
- Onboarding support: New hire checklists, policy orientation, system access guides. Automation rate: 72%. Per-query savings: $22. Annual volume: 1,200 queries (based on 15% hiring rate). Annual savings: $19,008.
- Payroll questions: Pay dates, tax withholding, direct deposit changes. Automation rate: 85%. Per-query savings: $10. Annual volume: 4,000 queries. Annual savings: $34,000.
- Policy lookups: Dress code, remote work, travel, expense policies. Automation rate: 88%. Per-query savings: $8. Annual volume: 2,800 queries. Annual savings: $19,712.
Total HR chatbot savings: $187,200/year for a 500-employee company. Payback period: 2.8 months.
IT Helpdesk
IT support chatbots deliver the highest absolute savings because IT tickets are the most frequent internal support category and many can be fully automated through workflow integration (not just answered but resolved). Compare these results with our analysis of AI helpdesk chatbot versus traditional ticketing systems.
- Password resets and account unlocks: Automated through Active Directory integration. Automation rate: 95%. Per-query savings: $15. Annual volume: 8,000 queries. Annual savings: $114,000.
- Software access requests: Pre-approved software provisioning via API. Automation rate: 70%. Per-query savings: $20. Annual volume: 3,200 queries. Annual savings: $44,800.
- VPN and connectivity troubleshooting: Guided diagnostics with automated fixes. Automation rate: 65%. Per-query savings: $18. Annual volume: 2,400 queries. Annual savings: $28,080.
- Device setup and configuration: Step-by-step guides with OS detection. Automation rate: 60%. Per-query savings: $25. Annual volume: 1,500 queries. Annual savings: $22,500.
- General IT FAQ: Printer setup, Wi-Fi, application how-tos. Automation rate: 85%. Per-query savings: $10. Annual volume: 3,600 queries. Annual savings: $30,600.
Total IT chatbot savings: $234,000/year. Payback period: 2.1 months.
Finance and Accounting
Finance chatbots have moderate automation rates because some queries require judgment or involve sensitive financial data. However, the queries they can automate are high-frequency and time-consuming.
- Expense report assistance: Policy lookup, receipt requirements, submission guidance. Automation rate: 82%. Per-query savings: $14. Annual volume: 5,000 queries. Annual savings: $57,400.
- Invoice and payment status: Integration with ERP for real-time status. Automation rate: 75%. Per-query savings: $12. Annual volume: 2,800 queries. Annual savings: $25,200.
- Budget questions: Remaining budget lookup, approval thresholds. Automation rate: 55%. Per-query savings: $16. Annual volume: 1,800 queries. Annual savings: $15,840.
- Tax document requests: W-2 access, tax withholding changes. Automation rate: 70%. Per-query savings: $10. Annual volume: 2,400 queries. Annual savings: $16,800.
- Procurement questions: Vendor approval, PO process, preferred suppliers. Automation rate: 50%. Per-query savings: $15. Annual volume: 1,600 queries. Annual savings: $12,000.
Total Finance chatbot savings: $124,800/year. Payback period: 3.5 months.
Operations
Operations chatbots handle facility management, supply orders, room bookings, and process coordination. They deliver solid ROI with growing automation rates as more operational workflows get integrated.
- Facility and maintenance requests: Submitting work orders, checking status. Automation rate: 65%. Per-query savings: $12. Annual volume: 3,000 queries. Annual savings: $23,400.
- Room and resource booking: Calendar integration for conference rooms. Automation rate: 80%. Per-query savings: $8. Annual volume: 4,500 queries. Annual savings: $28,800.
- Supply ordering: Standardized supply requests with auto-approval. Automation rate: 72%. Per-query savings: $10. Annual volume: 2,000 queries. Annual savings: $14,400.
- Process and procedure questions: How to submit forms, approval chains, deadlines. Automation rate: 75%. Per-query savings: $9. Annual volume: 2,600 queries. Annual savings: $17,550.
- Visitor management: Guest registration, badge requests, parking. Automation rate: 68%. Per-query savings: $7. Annual volume: 2,500 queries. Annual savings: $11,900.
Total Operations chatbot savings: $96,000/year. Payback period: 4.2 months.
Break-Even Analysis: When Your Chatbot Pays for Itself
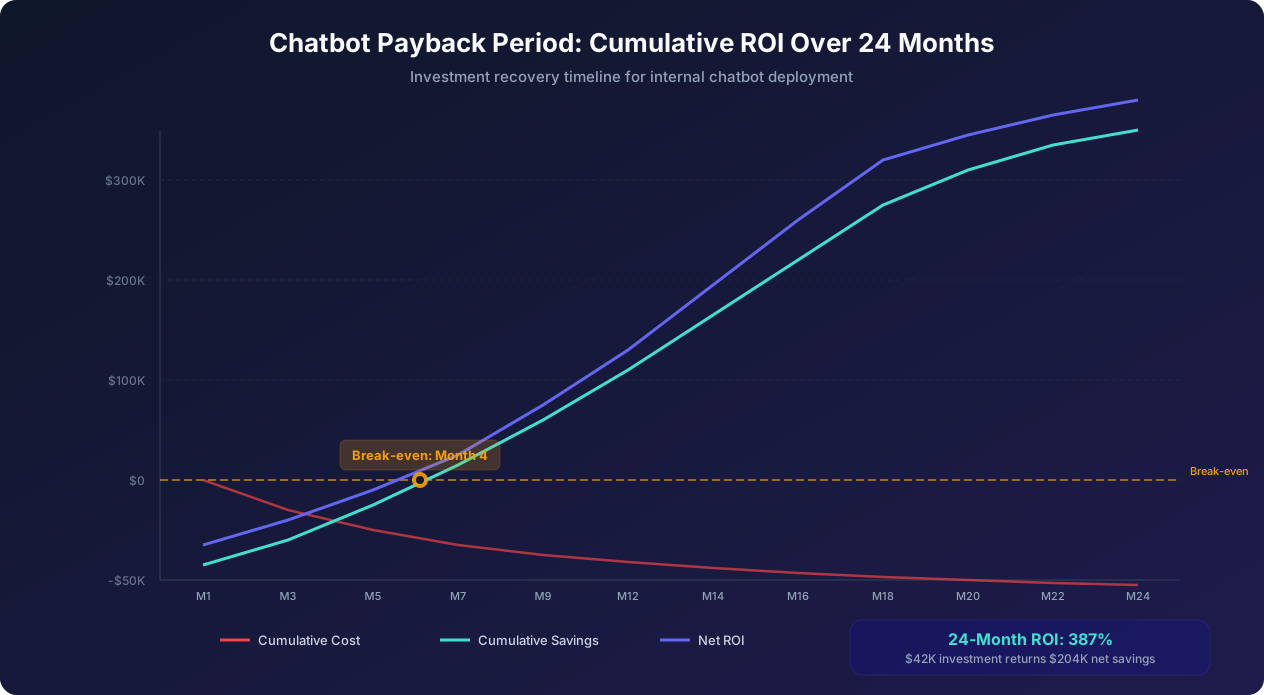
The break-even point is when cumulative savings exceed cumulative costs. For most internal chatbots, this happens between month 3 and month 6, making them one of the fastest-payback technology investments available.
First-Year Cost Structure
To calculate break-even, you need to understand the month-by-month cost and savings profile. Chatbot costs are front-loaded (setup and configuration happen in months 1-2), while savings ramp up over time as the chatbot learns and adoption increases.
Typical cost profile for an internal chatbot deployment:
| Cost Category | Month 1 | Month 2 | Months 3-12 | Year 1 Total |
|---|---|---|---|---|
| Platform subscription | $300 | $300 | $300/month | $3,600 |
| Setup and configuration | $5,000 | $3,000 | $0 | $8,000 |
| Knowledge base creation | $3,000 | $2,000 | $500/month | $10,000 |
| Integration development | $4,000 | $4,000 | $0 | $8,000 |
| Training and change management | $2,000 | $1,000 | $200/month | $5,000 |
| Ongoing optimization | $0 | $0 | $800/month | $8,000 |
| Monthly Total | $14,300 | $10,300 | $1,800/mo | $42,600 |
Savings Ramp-Up
Savings do not start at full capacity. Employee adoption grows gradually, the chatbot knowledge base expands, and automation workflows get refined. Here is a realistic savings ramp:
- Month 1: 25% of full savings ($6,350/month of the $25,400 monthly run-rate) as the chatbot handles basic queries and adoption is limited
- Month 2: 40% of full savings ($10,160/month) as early adopters spread the word
- Month 3: 55% of full savings ($13,970/month) as integrations go live
- Month 4: 68% of full savings ($17,272/month) as the chatbot has learned from thousands of interactions
- Months 5-8: 75% to 85% of full savings as remaining knowledge gaps get filled
- Months 9-12: 90% to 100% of full savings as the chatbot reaches maturity
Break-Even Calculation
Using these numbers for the moderate scenario ($25,400/month at full capacity):
- Month 1: Cumulative cost $14,300, cumulative savings $6,350 -- net: -$7,950
- Month 2: Cumulative cost $24,600, cumulative savings $16,510 -- net: -$8,090
- Month 3: Cumulative cost $26,400, cumulative savings $30,480 -- net: +$4,080
- Month 4: Cumulative cost $28,200, cumulative savings $47,752 -- net: +$19,552
Break-even occurs early in Month 3 for the moderate scenario. For the conservative scenario (using only direct agent time savings of $15,867/month), break-even occurs in Month 5.
Factors That Accelerate or Delay Break-Even
Accelerators:
- Using a no-code platform with pre-built templates (reduces setup cost)
- Starting with high-volume, simple queries (password resets, PTO checks)
- Active executive sponsorship driving adoption
- Existing structured knowledge base that can be imported
- Integration with existing systems (HRIS, Active Directory, ticketing)
Delays:
- Complex custom integrations requiring development work
- Poor existing documentation requiring extensive knowledge base creation
- Low employee adoption due to change resistance
- Starting with complex, low-volume query types
- Organizational resistance from support team fearing job displacement
Scaling Economics: How ROI Improves as Your Organization Grows
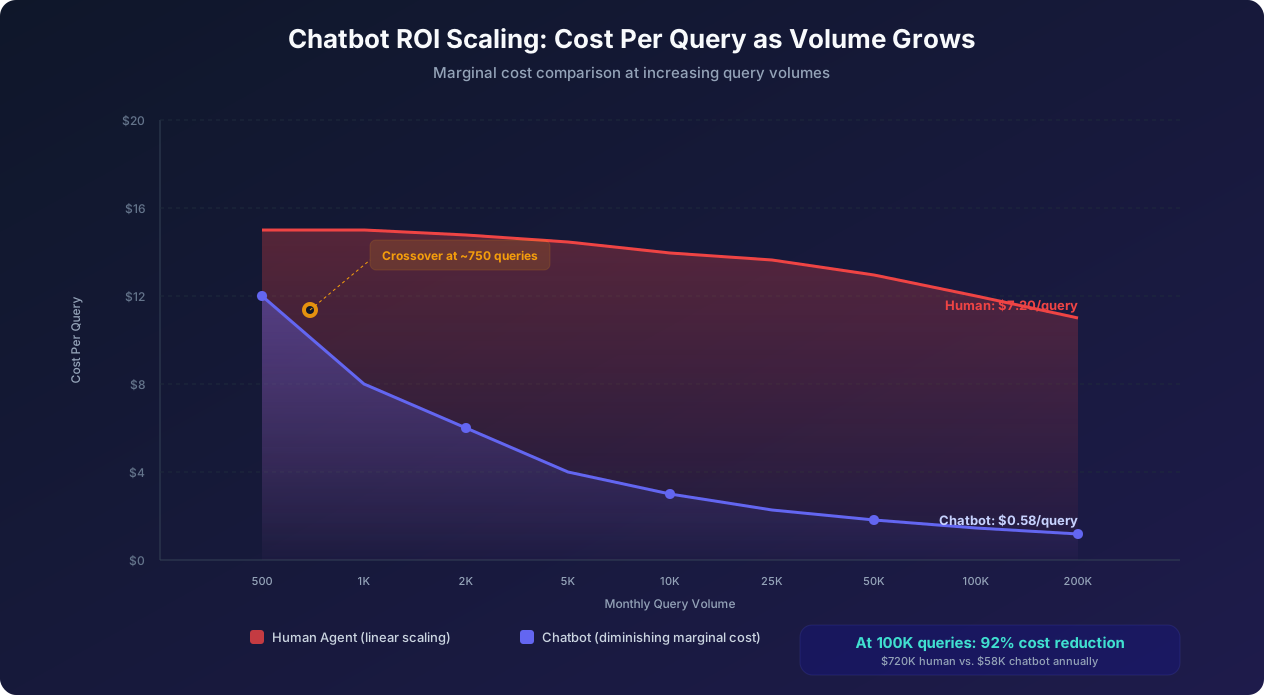
One of the most powerful aspects of internal chatbot ROI is that it improves as your organization scales. Unlike human support, which scales linearly (more employees means proportionally more support staff), chatbot capacity scales near-infinitely at marginal cost.
The Scaling Advantage
Consider what happens when your company grows from 500 to 1,000 employees:
Without chatbot: Support ticket volume roughly doubles. You need to hire 4-5 additional support FTEs at $80,000 each ($320,000-$400,000 additional annual cost). Training, management overhead, and tool licenses also increase proportionally.
With chatbot: Ticket volume doubles, but the chatbot handles the increase with no marginal cost increase (assuming you are within your platform's usage limits). You might need 1-2 additional FTEs for complex escalations ($160,000 additional). The chatbot's per-query cost drops from approximately $1.40 to $0.70 as fixed costs are spread across more queries.
This means the savings gap widens as you grow. At 500 employees, the chatbot might save $306,000 per year (conservative). At 1,000 employees, the same chatbot saves $650,000 per year because human support costs doubled while chatbot costs barely increased. At 2,000 employees, savings reach $1.4 million per year.
Multi-Department Expansion ROI
The economics improve further when you expand the chatbot from one department to multiple departments. The incremental cost of adding HR support to an existing IT chatbot is much lower than the initial deployment because the platform, infrastructure, and integration framework are already in place. Only the knowledge base content and department-specific workflows need to be added.
Incremental deployment costs:
- First department (IT): $42,600 (full setup)
- Second department (HR): $18,000 (knowledge base + workflows only)
- Third department (Finance): $15,000 (knowledge base + minimal integration)
- Fourth department (Operations): $12,000 (knowledge base only)
Each additional department adds $80,000-$230,000 in annual savings at a fraction of the original setup cost. The ROI for the second, third, and fourth departments is dramatically higher than the first because the platform investment is already amortized.
Compound Improvement Over Time
Internal chatbots exhibit compound improvement through several mechanisms. First, the knowledge base grows with every interaction. Questions the chatbot could not answer in month 1 get added as new content, increasing the deflection rate by 1-2 percentage points per month for the first 12 months. Second, machine learning models improve their intent recognition and response accuracy through training on conversation data. Third, user behavior shifts over time: employees who get fast, accurate answers from the chatbot develop the habit of going to it first, further reducing the load on human support teams. Fourth, as trust builds, departments are willing to expose more complex workflows through the chatbot, expanding its capabilities into areas that were initially considered too sensitive or complex for automation.
These compound improvements mean that a chatbot delivering high deflection in Year 1 typically reaches high deflection by Year 3, with no proportional increase in costs. The ROI literally improves every year without additional investment.
Executive Presentation Template: How to Get Budget Approval
Knowing the numbers is only half the battle. You also need to present them in a format that resonates with executive decision-makers, and McKinsey's digital transformation research identifies executive sponsorship as the single strongest predictor of AI project success. Here is a proven template for presenting internal chatbot ROI to leadership.
Slide 1: The Problem (Cost of Status Quo)
Lead with the pain point, not the solution. Present your current internal support costs:
- Total annual cost of internal support: $762,000
- Average employee wait time for support resolution: 4.2 hours
- Support team capacity utilization: 110% (they are already overloaded)
- Employee satisfaction with internal support: 5.8/10 (from your last employee survey)
- Year-over-year support ticket growth: 12% (unsustainable without hiring)
The frame should be: "We are spending $762K per year and employees are still dissatisfied. As we grow, this problem gets worse, not better."
Slide 2: The Opportunity (What Chatbots Achieve)
Share industry benchmarks and peer company results:
- The share of routine internal queries your pilot resolved without a human
- Employee satisfaction with chatbot support: 8.2/10 average (when deployed well)
- Average first-response time drops from 4.2 hours to under 10 seconds
Slide 3: The Financial Case (Your ROI Numbers)
Present three scenarios side by side. Always lead with the conservative number:
- Conservative (direct savings only): $306,400 annual savings, a positive ROI, 5-month payback
- Moderate (direct + avoided hiring): $964,740 annual savings, a positive ROI, 3-month payback
- Optimistic (all savings categories): $1,623,080 annual savings, a positive ROI, 2-month payback
Emphasize: "Even in the most conservative scenario where we count only direct cost savings and exclude all productivity gains, the chatbot pays for itself in 5 months and delivers a positive return."
Slide 4: The 3-Year View
Show the compounding TCO comparison chart. The gap between status quo costs and chatbot-assisted costs widens every year as the company grows. At Year 3, the cumulative savings reach $750K to $1.1M.
Slide 5: Risk Mitigation
Address the objections before they are raised:
- "What if employees do not use it?" Change management plan included in budget. Phased rollout starting with IT (highest-volume, easiest wins) builds early success stories.
- "Will it handle our complex queries?" We are starting with the 68% of queries that are routine and well-documented. Complex queries remain with human agents. The chatbot reduces their workload so they can give complex issues more attention.
- "What about data security?" Security review included in implementation plan. The platform is SOC 2 compliant, data is encrypted at rest and in transit, and audit logging captures all interactions.
- "What is the exit strategy?" If the chatbot underperforms, we can shut it down with zero switching cost. The knowledge base content we create has independent value. Monthly subscription means no long-term commitment.
Slide 6: The Ask and Timeline
Present a clear investment ask with a phased timeline:
- Phase 1 (Months 1-2): IT helpdesk chatbot -- $25,000 setup + $300/month -- prove the model
- Phase 2 (Months 3-4): Add HR support -- $18,000 incremental setup
- Phase 3 (Months 5-6): Add Finance and Operations -- $27,000 incremental setup
- Total Year 1 investment: $42,600
- Expected Year 1 savings: $306,400 (conservative) to $964,740 (moderate)
The phased approach is important because it lets you prove ROI with the first department before committing to the full deployment. Phase 1 alone delivers positive ROI within 3 months, creating internal momentum for Phases 2 and 3.
Measuring Actual ROI After Deployment: The Tracking Framework
Projected ROI gets the budget approved. Measured ROI proves the investment was sound and justifies expansion. Here is the framework for tracking actual ROI once your internal chatbot is live.
Key Metrics to Track Monthly
1. Deflection Rate: The number-one metric. Track the percentage of total queries that the chatbot resolves without human intervention. Break this down by department, query type, and complexity level. Target: 60% in Month 1 rising to 80% by Month 12.
2. Cost Per Resolution: Calculate the average cost of a chatbot-resolved query versus a human-resolved query. Chatbot cost per resolution = (monthly platform cost + maintenance cost) / number of chatbot resolutions. Target: chatbot resolution cost should be under $2 by Month 6 compared to $12-$18 for human resolution.
3. Employee Satisfaction (ESAT): Survey employees who interact with the chatbot. Use a simple 1-5 star rating after each interaction plus a quarterly deep-dive survey. Target: 4.0+ stars average. Scores below 3.5 indicate quality issues that will erode adoption.
4. Mean Time to Resolution (MTTR): Average time from query submission to resolution, for both chatbot and human paths. The chatbot should show dramatic improvement: from the baseline 4.2-hour MTTR to under 2 minutes for chatbot-resolved queries. Track the human MTTR separately to ensure the chatbot is not sending harder tickets to humans (which would increase human MTTR even as overall MTTR drops).
5. Adoption Rate: Percentage of employees who have used the chatbot at least once, and percentage who are repeat users. Week-over-week growth in unique users is a leading indicator of long-term success. Target: 60% of employees by Month 3, 80% by Month 6.
6. Knowledge Base Coverage: Percentage of incoming queries that the chatbot can confidently address (even if the employee ultimately escalates). Track the "I do not know" rate and work to reduce it by adding missing content. Target: under 10% unknown-query rate by Month 6.
ROI Dashboard Template
Create a monthly dashboard that maps directly to your business case projections. For each line item in your original business case, show the projected value versus actual value. This transparency builds credibility and makes it easy to identify areas where the deployment is overperforming or underperforming projections.
| Metric | Projected (Month 6) | Actual (Month 6) | Variance |
|---|---|---|---|
| Deflection rate | 68% | Track actual | +/- % |
| Monthly tickets deflected | 1,700 | Track actual | +/- # |
| Monthly cost savings | $25,400 | Calculate actual | +/- $ |
| Employee satisfaction | 4.0/5.0 | Track actual | +/- rating |
| Chatbot MTTR | Under 2 min | Track actual | +/- min |
| Adoption rate | 60% | Track actual | +/- % |
Report this dashboard monthly to the executive sponsor for the first 6 months, then quarterly thereafter. Early wins should be communicated broadly to build organizational support for expansion to additional departments.
Optimization Triggers
Use these thresholds to trigger specific optimization actions:
- Deflection rate below 50%: Review knowledge base gaps, retrain intent recognition, check for technical issues
- Satisfaction below 3.5/5.0: Conduct conversation quality audit, improve response accuracy, add empathy to escalation messages
- Adoption rate stalling: Launch internal marketing campaign, add chatbot access points (Slack integration, email auto-reply), incentivize usage
- Cost per resolution increasing: Check for platform pricing tier changes, optimize conversation flow length, reduce unnecessary API calls
Was this article helpful?
Build and deploy in 10 minutes. No coding needed.
Internal Chatbot ROI FAQ
Everything you need to know about chatbots for internal chatbot roi.
About the Author
The Conferbot team writes about building, deploying, and improving AI chatbots.
View all articles