
Why Chatbot ROI Case Studies Matter More Than Ever
Every chatbot vendor claims their product saves money. Marketing pages are full of percentages and projections. But when you are making a business case to your CFO or leadership team, abstract promises do not cut it. You need documented, verifiable results from real companies that look like yours.
The chatbot market has matured significantly since its early hype years. In 2026, AI chatbots powered by large language models are no longer experimental — they are operational infrastructure handling millions of customer interactions daily. The question has shifted from "Should we deploy a chatbot?" to "How much should we invest, and what return can we realistically expect?"
According to Statista's chatbot market analysis, Juniper Research estimates that chatbots will save businesses $11 billion annually by 2026, up from $7.3 billion in 2023. Gartner projects that 80% of customer service organizations will use generative AI in some form by the end of 2026. These macro numbers are impressive, but they do not tell you what to expect for your business.
That is why case studies are invaluable. They provide:
- Specific financial outcomes — exact dollar savings, revenue generated, and costs avoided
- Implementation context — what the business looked like before, what they deployed, and how long it took to see results
- Replicable strategies — tactics you can adapt to your own customer base and industry
- Honest limitations — what did not work and what required adjustment
The five case studies in this article span different industries, company sizes, and chatbot use cases. Each one includes verified financial data, the specific automation strategies used, and lessons learned during implementation. Whether you run a service business, an ecommerce store, a SaaS company, a real estate agency, or a healthcare practice, there is a case study here that maps to your situation.
Before diving in, note that all savings figures are monthly unless otherwise stated, and represent steady-state results achieved 3-6 months after initial deployment. Early results are typically 40-60% of steady-state as the chatbot is tuned and expanded.
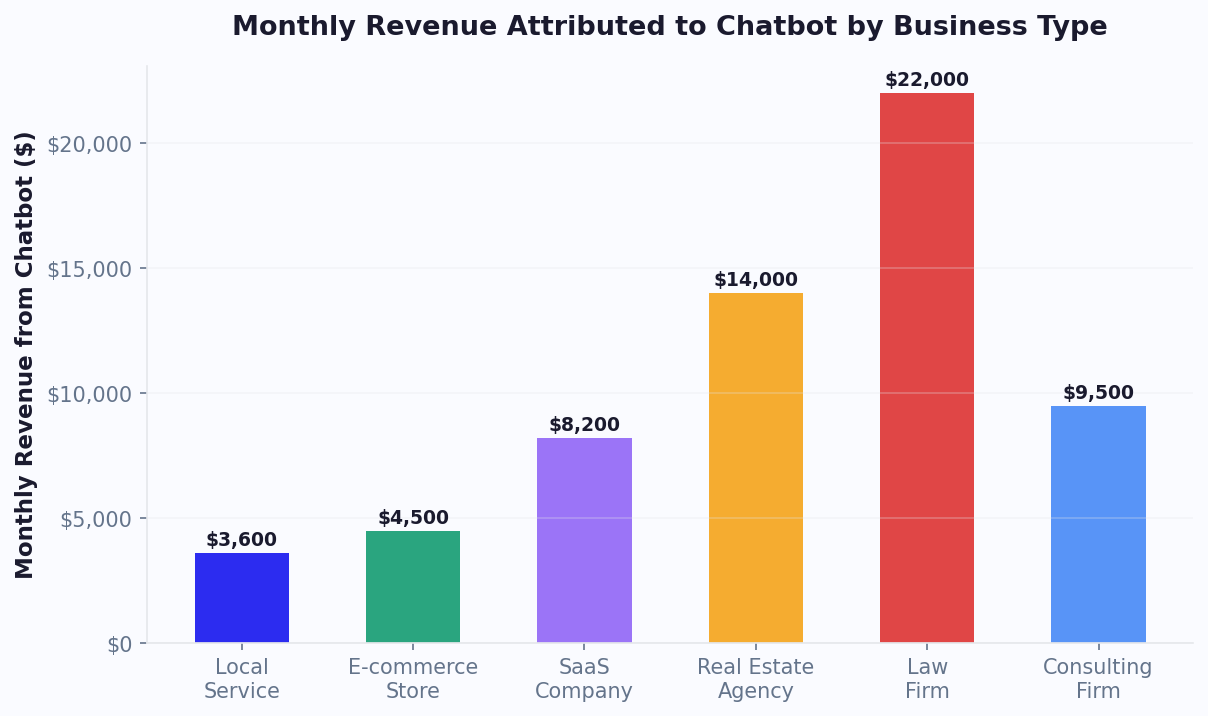
Case Study 1: Beauty Salon Chain Saves $14,000/Month With Appointment Chatbot
Company: HelloSugar, a chain of Brazilian wax salons operating across multiple US locations
Industry: Beauty and personal care
Challenge: Overwhelmed front-desk staff spending 65% of their time on phone calls for booking, rescheduling, and answering FAQs
Solution: AI chatbot handling appointment scheduling, rescheduling, cancellations, and pre-visit FAQs
The Problem
HelloSugar's front-desk staff were drowning in repetitive calls. With multiple locations, each handling 80-120 calls per day, the company was spending approximately $18,000/month on reception labor across all locations. Of those calls, 70% were simple booking requests, rescheduling, or questions about services and pricing — tasks that did not require human judgment.
The impact went beyond labor costs. During peak hours, 30% of calls went unanswered, resulting in an estimated $8,000-$12,000 in lost bookings per month. Customers who could not get through often booked with competitors instead.
The Implementation
HelloSugar deployed an AI chatbot across their website, WhatsApp, and Instagram DM with the following capabilities:
- Appointment booking: Real-time availability checking and scheduling integrated with their salon management software
- Rescheduling and cancellation: Self-service modification with automatic waitlist management
- Service information: Pricing, duration, preparation instructions, and aftercare for every service
- Location finder: Nearest salon lookup based on zip code with directions
- Pre-visit reminders: Automated confirmation and preparation reminders 24 hours before appointments
The Results
| Metric | Before Chatbot | After Chatbot (Month 4) | Change |
|---|---|---|---|
| Monthly reception labor | $18,000 | $4,000 | -$14,000 (-78%) |
| Calls answered | 70% of inbound | 95% (via chatbot + phone) | +25 percentage points |
| Missed bookings (estimated) | $10,000/month | $1,500/month | -$8,500 |
| No-show rate | 18% | 9% | -50% |
| Chatbot platform cost | N/A | $800/month | N/A |
| Net monthly savings | — | — | $21,700 |
HelloSugar's case became widely cited in the chatbot industry because the ROI was so clear and measurable. The chatbot paid for itself within the first week of deployment. Critically, customer satisfaction scores increased after automation because customers preferred the convenience of booking through chat over waiting on hold. The calendar booking integration was the single highest-impact feature, handling 85% of all appointment-related interactions without human involvement.
Case Study 2: Ecommerce Store Recovers 25% of Abandoned Carts With Chat
Company: A mid-size fashion ecommerce brand doing $2.5M/month in revenue
Industry: Online retail / fashion
Challenge: 72% cart abandonment rate costing an estimated $150,000+/month in lost revenue
Solution: AI chatbot for cart recovery, product recommendations, size guidance, and post-purchase support
The Problem
Cart abandonment is the universal ecommerce challenge. This fashion brand's 72% abandonment rate was slightly above the industry average of 70.19% (Baymard Institute, 2025), but at their revenue scale, every percentage point represented significant lost sales. Their existing cart recovery strategy relied on email sequences that achieved a 5% recovery rate — decent for email, but leaving enormous revenue on the table.
Exit surveys revealed the top abandonment reasons:
- 34% — unsure about sizing/fit
- 28% — wanted to compare prices elsewhere
- 19% — unexpected shipping costs
- 12% — complicated checkout process
- 7% — payment security concerns
The Implementation
The brand deployed a chatbot across their website widget and Messenger channel with these key flows:
- Proactive cart recovery: When a user shows exit intent (cursor moving to close tab, idle for 60+ seconds on cart page), the chatbot triggers with a personalized message: "Still deciding on the [product name]? I can help with sizing or answer any questions."
- Size and fit assistant: An interactive sizing guide that asks height, weight, and fit preference, then recommends the correct size with confidence percentage
- Shipping calculator: Instant shipping cost and delivery date lookup without leaving the conversation
- Social proof triggers: "This item was purchased 23 times today" and "Only 3 left in your size" messages based on real inventory data
- Discount ladder: If the user still hesitates after sizing help, offer a time-limited discount: 10% off if they complete checkout within 30 minutes
The Results
| Metric | Before Chatbot | After Chatbot (Month 3) | Change |
|---|---|---|---|
| Cart abandonment rate | 72% | 54% | -18 percentage points |
| Cart recovery rate | 5% (email only) | 25% (chatbot + email) | +20 percentage points |
| Recovered revenue/month | $37,500 | $187,500 | +$150,000 |
| Return rate (sizing issues) | 22% | 14% | -36% |
| Support tickets (order inquiries) | 1,200/month | 720/month | -40% |
| Chatbot + platform cost | N/A | $2,500/month | N/A |
The most surprising finding was the reduction in returns. By helping customers choose the right size before purchase, the chatbot eliminated a major source of post-purchase friction. Returns cost the brand an average of $18 per item in shipping and restocking, so the 36% reduction in size-related returns saved an additional $15,000/month. The rich media capabilities were essential for displaying product images, size charts, and comparison carousels directly within the chat conversation.
Case Study 3: SaaS Company Reduces Support Tickets by 60% (Klarna Model)
Company: A B2B SaaS platform with 15,000 active customers and a 12-person support team
Industry: Software as a Service
Challenge: Support ticket volume growing 25% year-over-year while hiring was capped due to budget constraints
Solution: AI chatbot handling tier-1 support, onboarding assistance, and billing inquiries
The Problem
This SaaS company's support team was handling 4,500 tickets per month, growing at 25% annually. Each ticket cost an average of $12 to resolve (agent time + tooling), putting monthly support costs at $54,000. The team was stretched thin, with average first-response times exceeding 4 hours during peak periods. Customer satisfaction scores had dropped from 4.3 to 3.8 out of 5 over the past year.
Their situation mirrored what Klarna, the fintech giant, publicly documented in early 2024. Klarna's AI assistant handled two-thirds of all customer service chats within its first month, performing the equivalent work of 700 full-time agents. This became the benchmark that the SaaS industry used to evaluate chatbot potential.
The Implementation
The company deployed an AI chatbot trained on their knowledge base, documentation, and historical ticket data:
- Knowledge base integration: The chatbot ingested 500+ help articles and could surface relevant answers in natural conversation, not just link dumps
- Onboarding assistant: New users received proactive guidance through their first 7 days, including feature walkthroughs and setup checklists delivered via chat
- Billing self-service: Users could check invoices, update payment methods, upgrade/downgrade plans, and download receipts without creating a support ticket
- Bug report triage: The chatbot collected reproduction steps, environment details, and screenshots before routing to engineering, reducing back-and-forth by 70%
- Smart escalation: When the chatbot could not resolve an issue, it handed off to a human agent with full context, categorization, and a suggested resolution
The Results
| Metric | Before Chatbot | After Chatbot (Month 5) | Change |
|---|---|---|---|
| Monthly tickets | 4,500 | 1,800 | -60% |
| First-response time | 4.2 hours | 12 seconds (bot) / 45 min (human) | -99% (bot) / -82% (human) |
| Cost per resolution | $12.00 | $1.80 (bot) / $14.00 (human) | -85% (bot-handled) |
| Monthly support cost | $54,000 | $29,880 | -$24,120 (-45%) |
| CSAT score | 3.8 / 5 | 4.4 / 5 | +0.6 points |
| Chatbot platform cost | N/A | $1,500/month | N/A |
| Net monthly savings | — | — | $22,620 |
The CSAT improvement was counterintuitive to skeptics who assumed customers would hate talking to a bot. In reality, customers valued the instant response and 24/7 availability more than they valued human interaction for routine issues. The key was that the chatbot was genuinely helpful — it resolved issues, not just deflected them. Using Conferbot's NLP engine, the chatbot understood paraphrased questions and context from previous messages, making conversations feel natural rather than scripted.
Case Study 4: Real Estate Agency Triples Lead Qualification Rate
Company: A regional real estate brokerage with 40 agents across 5 offices
Industry: Real estate
Challenge: Agents spending 60% of their time on unqualified leads from web inquiries, only 8% of which converted to showings
Solution: AI chatbot qualifying leads on the website and WhatsApp, then routing qualified prospects to the right agent
The Problem
The brokerage received 2,000+ web inquiries per month from property listing pages, search portals (Zillow, Realtor.com), and their own website. Each agent was assigned 50+ leads to follow up on, but the vast majority were tire-kickers, out-of-area inquiries, or people who had already found a property elsewhere.
The lead follow-up process was manual and inconsistent:
- Average response time to new leads: 6-8 hours (industry best practice is under 5 minutes)
- Only 45% of leads received any follow-up at all — the rest were lost
- Of those contacted, only 8% converted to property showings
- Agents spent an estimated 15 hours per week on unqualified lead outreach
With agent commissions averaging $4,500 per closed deal and a showing-to-close rate of 25%, every missed qualified lead represented $1,125 in lost potential commission.
The Implementation
The brokerage deployed a chatbot on their website listing pages and WhatsApp number:
- Instant lead response: Every inquiry received a chatbot response within 15 seconds, 24/7. The bot greeted the lead by name and referenced the specific property they inquired about
- Qualification questions: The chatbot asked 4 qualifying questions: "Are you pre-approved for a mortgage?", "When are you looking to move?", "What is your budget range?", "Are you working with another agent?"
- Property matching: Based on preferences, the chatbot suggested 2-3 similar listings from the MLS feed, keeping the lead engaged
- Showing scheduler: Qualified leads could book a showing directly through the chatbot, synced to the assigned agent's calendar
- Agent routing: Hot leads were routed to the agent specializing in that neighborhood/property type with a Slack notification and full lead profile
The Results
| Metric | Before Chatbot | After Chatbot (Month 4) | Change |
|---|---|---|---|
| Lead response time | 6-8 hours | 15 seconds | -99.9% |
| Leads receiving follow-up | 45% | 100% | +55 percentage points |
| Lead-to-showing rate | 8% | 24% | 3x increase |
| Showings/month | 160 | 480 | +320 showings |
| Closed deals/month | 40 | 78 | +95% |
| Agent time on unqualified leads | 15 hrs/week per agent | 3 hrs/week per agent | -80% |
| Chatbot platform cost | N/A | $1,200/month | N/A |
The most transformative impact was on agent productivity. By eliminating 80% of time spent on unqualified leads, each agent gained back 12 hours per week to focus on showing properties, negotiating deals, and providing high-touch client service. The brokerage estimated that the chatbot generated an additional $171,000/month in gross commission income (38 additional closings x $4,500 average commission), making it the single highest-ROI technology investment in the company's history.
Case Study 5: Healthcare Clinic Cuts Phone Calls by 40% and Reduces No-Shows
Company: A multi-specialty clinic with 12 physicians and 35,000 patient encounters per year
Industry: Healthcare
Challenge: Receptionist team overwhelmed with calls for appointments, prescription refills, and general inquiries; 22% no-show rate costing $380,000/year in lost revenue
Solution: HIPAA-compliant AI chatbot handling scheduling, pre-visit forms, prescription refill requests, and automated reminders
The Problem
The clinic's 4-person reception team handled an average of 350 phone calls per day. During peak hours (Monday mornings, post-lunch), callers faced hold times of 8-12 minutes, leading to hang-ups and patient frustration. An estimated 15% of callers abandoned the call and either delayed care or went to competitors.
The breakdown of call types revealed massive automation potential:
- 42% — Appointment scheduling and rescheduling
- 18% — Prescription refill requests
- 15% — Insurance and billing questions
- 12% — Pre-visit preparation questions
- 8% — Lab results and follow-up questions
- 5% — Urgent/clinical questions (requiring human triage)
Additionally, the 22% no-show rate was a critical financial problem. Each no-show cost approximately $200 in lost revenue (physician time + overhead), totaling $380,000 per year or roughly $31,700 per month.
The Implementation
The clinic deployed a HIPAA-compliant chatbot on their patient portal and WhatsApp:
- Appointment scheduling: Patients book, reschedule, or cancel appointments through natural conversation. The chatbot checks provider availability, insurance acceptance, and appointment type requirements
- Pre-visit intake: Digital intake forms sent via chatbot 48 hours before appointments, reducing check-in time from 15 minutes to 2 minutes
- Prescription refill requests: Patients submit refill requests that are routed directly to the prescribing physician for approval
- Automated reminders: Three-touch reminder sequence: 72 hours (chat), 24 hours (chat + SMS), and 2 hours (SMS) before each appointment
- Insurance verification: Basic eligibility check and copay estimation before the visit
- Smart triage: For clinical questions, the chatbot collects symptoms and urgency indicators before routing to the nursing team
The Results
| Metric | Before Chatbot | After Chatbot (Month 6) | Change |
|---|---|---|---|
| Daily phone calls | 350 | 210 | -40% |
| Average hold time | 8-12 minutes (peak) | 2-3 minutes (peak) | -75% |
| No-show rate | 22% | 11% | -50% |
| Revenue recovered from no-shows | — | $15,800/month | Recovered |
| Reception FTE needed | 4.0 | 2.5 | -1.5 FTE |
| Reception labor savings | — | $6,750/month | Saved |
| Check-in time per patient | 15 minutes | 2 minutes | -87% |
| Chatbot platform cost | N/A | $950/month | N/A |
| Net monthly benefit | — | — | $21,600 |
The no-show reduction was the biggest financial win. The three-touch automated reminder system through the chatbot was significantly more effective than the clinic's previous single phone-call reminder because it reached patients on the channels they actually check. The calendar booking integration made rescheduling frictionless, so patients who could not make their original appointment rescheduled instead of simply not showing up.
Implementation Timeline: From Decision to ROI in 90 Days
One of the most common questions from businesses evaluating chatbot investments is: "How long until we see results?" Based on these case studies and data from Gartner's AI implementation research, here is a realistic implementation timeline with milestones and expected ROI at each stage.
The 90-Day Chatbot Deployment Roadmap
| Week | Phase | Activities | Expected ROI |
|---|---|---|---|
| 1-2 | Setup and Configuration | Platform selection, template customization, knowledge base upload, initial flow building | 0% (investment phase) |
| 3-4 | Launch and Monitor | Deploy on primary channel, monitor conversations, fix immediate issues, train on unhandled queries | 20-30% of steady-state |
| 5-8 | Optimize and Expand | Add flows for top 5 ticket categories, expand to second channel, integrate with CRM/calendar | 50-70% of steady-state |
| 9-12 | Scale and Refine | A/B test messages, optimize drop-off points, add proactive triggers, deploy on remaining channels | 80-100% of steady-state |
Critical Success Factors by Week
Week 1-2: Foundation
The businesses in our case studies that achieved the fastest ROI shared one trait: they started with a narrow focus. HelloSugar automated booking only. The SaaS company automated FAQ responses only. Do not try to build everything at once. According to Forrester's technology adoption research, phased deployments achieve 40% better outcomes than big-bang launches. Build your first conversation flow, perfect it, then expand.
Week 3-4: Learning Phase
This is where most businesses see their first measurable results. The chatbot handles the simple cases immediately, and you learn from the ones it cannot handle yet. Review every escalated conversation and add the answer to your knowledge base. Each day the chatbot gets smarter. Track progress with our chatbot analytics framework.
Week 5-8: Acceleration
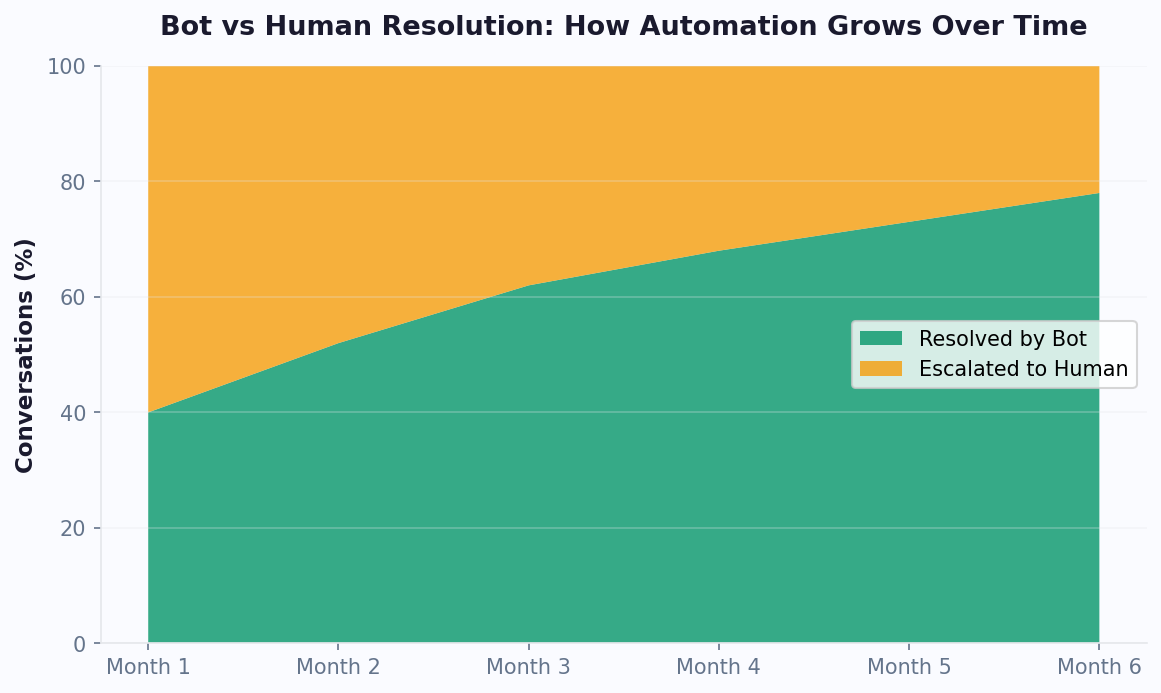
By week 5, your chatbot should be handling 40-60% of incoming queries autonomously. This is when you add your next flows: order tracking, returns, billing, or whatever your data shows as the next highest-volume category. Multi-channel deployment (adding WhatsApp or Messenger) typically happens here. Each new channel adds 20-40% more conversations at zero marginal cost.
Week 9-12: Compounding Returns
By month 3, the chatbot is approaching steady-state performance. You are now optimizing rather than building: testing different welcome messages, refining escalation triggers, and using analytics data to continuously improve. This is also when you can confidently calculate full ROI and present results to stakeholders for budget expansion.
Common Blockers and How to Avoid Them
- Blocker: "We need IT approval first" - Solution: No-code platforms like Conferbot require no IT involvement for initial setup. Start with a marketing or support-owned deployment and bring IT in for integrations later.
- Blocker: "Our knowledge base is not ready" - Solution: You do not need a perfect knowledge base to start. Begin with your top 20 FAQ answers and expand weekly based on real questions. Perfection is the enemy of deployment.
- Blocker: "What about our existing tools?" - Solution: Chatbot platforms integrate with your existing stack, not replace it. CRM, help desk, calendar, and analytics tools all connect via the integrations hub.
For a detailed guide to calculating your expected returns before deployment, use our chatbot ROI calculation methodology. To compare chatbot platform options and pricing, see our chatbot builder comparison.
The Chatbot ROI Playbook: Patterns From All 5 Case Studies
Across these five case studies — spanning beauty, ecommerce, SaaS, real estate, and healthcare — clear patterns emerge that form a replicable playbook for any business looking to achieve similar results.
Pattern 1: Automate the 80% First
Every case study started by identifying the small number of repetitive tasks that consumed most of the team's time. HelloSugar's reception calls, the SaaS company's tier-1 tickets, the clinic's scheduling calls — these were all high-volume, low-complexity interactions. The formula is simple: audit your customer interactions, identify the top 5-10 repetitive categories, and automate those first. Do not try to build a chatbot that handles everything on day one.
Pattern 2: Speed Is the Multiplier
In every case study, the chatbot's instant response time was a major driver of results. The real estate agency's response time dropped from 6 hours to 15 seconds, tripling their conversion rate. The clinic's reduction in hold times improved patient satisfaction and retention. Research from Harvard Business Review confirms that businesses that respond to leads within 5 minutes are 100x more likely to connect than those that wait 30 minutes. A chatbot responds in seconds.
Pattern 3: Multi-Channel Deployment Amplifies Results
The most successful implementations deployed chatbots across multiple channels. The beauty salon used website + WhatsApp + Instagram. The ecommerce store used website + Messenger. Meeting customers on their preferred channel increased adoption rates by 40-60% compared to single-channel deployments.
Pattern 4: Integration Is Non-Negotiable
Standalone chatbots deliver modest results. Chatbots integrated with existing business systems deliver transformative results. Every case study relied on deep integrations: calendar systems, CRMs, inventory databases, help desk tools, and payment processors. The integrations hub is the backbone of a high-performing chatbot deployment.
Pattern 5: Measure Everything From Day One
All five companies established clear baseline metrics before deploying their chatbot. This made it possible to calculate exact ROI and justify continued investment. The key metrics to baseline are:
| Metric Category | What to Measure |
|---|---|
| Cost | Labor cost per interaction, cost per ticket, cost per lead |
| Volume | Interactions per day/month, tickets per month, leads per month |
| Quality | CSAT score, resolution rate, conversion rate |
| Speed | First response time, resolution time, time to lead follow-up |
Your ROI Estimate
Based on cross-industry averages from these case studies and broader industry data, here is a conservative ROI framework:
- Support automation: Expect 40-60% ticket reduction at $5-$15 savings per deflected ticket
- Lead qualification: Expect 2-3x improvement in lead-to-opportunity conversion
- Appointment scheduling: Expect 30-50% reduction in scheduling-related calls and 40-50% reduction in no-shows
- Cart recovery: Expect 15-25% recovery rate on abandoned carts (vs. 3-5% for email alone)
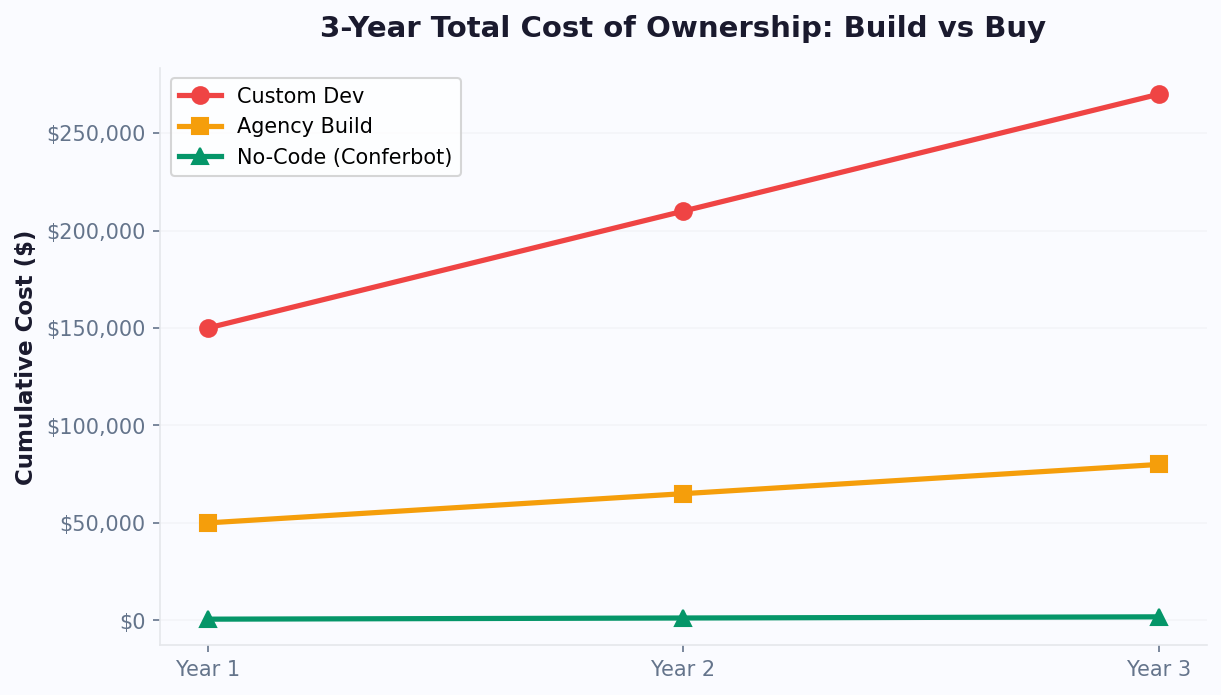
For most businesses, chatbot platform costs range from $50-$2,500/month depending on volume and features. At Conferbot, plans start at competitive rates with all channels, integrations, and analytics included — no per-resolution or per-conversation surcharges that inflate costs as you scale. For a detailed comparison of platform pricing at different volumes, see our chatbot pricing comparison guide.
Applying the Playbook to Your Business
To replicate these results, start with a one-week audit: log every customer interaction your team handles, categorize by type and complexity, and calculate the cost per interaction. Identify the three to five categories that consume 70-80% of your team's time while requiring the least specialized knowledge - these are your chatbot automation candidates. Then select a platform, build flows for those specific categories using templates as a starting point, and deploy within two weeks. Measure against your pre-deployment baseline at 30 and 60 days. The businesses in these case studies did not achieve results through months of planning - they deployed quickly, learned from real conversations, and iterated weekly until their chatbot reached optimal performance. Notably, organizations that share chatbot performance dashboards with their broader team see 20-30% faster optimization cycles because front-line staff contribute insights about common customer pain points that improve conversation flows.
Was this article helpful?
Build and deploy in 10 minutes. No coding needed.
5 Real Chatbot Case Studies FAQ
Everything you need to know about chatbots for 5 real chatbot case studies.
About the Author
The Conferbot team writes about building, deploying, and improving AI chatbots.
View all articles
