Why A/B Testing Is the Difference Between a Good Chatbot and a Great One
Most chatbot implementations are launched based on assumptions - assumptions about what greeting message will engage visitors, which conversation flow will convert leads, and what call-to-action will drive the desired behavior. These assumptions might be informed by best practices and industry knowledge, but they are still guesses. And guesses leave enormous performance on the table.
The pattern holds across implementations: chatbots that undergo systematic A/B testing consistently outperform unoptimized chatbots on the metrics that matter. A better greeting message alone can meaningfully lift engagement. A flow optimization pass can increase lead qualification rates. A sharper call-to-action can boost click-through. Compound these improvements together over successive tests, and an optimized chatbot can substantially outperform its untested initial version - see our guide to chatbot flow and A/B testing statistics for how these gains stack over a testing program.
Yet most businesses never test their chatbot at all, even though rigorous A/B testing of landing pages and marketing emails is now standard practice for the same teams. This gap represents a massive opportunity - if you implement rigorous testing while your competitors do not, you gain a compounding advantage that widens over time.
The challenge with chatbot A/B testing is that it differs fundamentally from testing static web elements. Conversations are multi-step, context-dependent, and highly variable. A visitor might engage with 3 messages or 30. The same greeting might perform differently on mobile vs. desktop, during business hours vs. evenings, or for first-time visitors vs. returning ones. Traditional A/B testing tools were not designed for these complexities.
This guide provides a complete framework for chatbot A/B testing: what to test (and in what order for maximum impact), how to design rigorous experiments, how to calculate statistical significance for conversational data, specific strategies for greeting tests, flow tests, and CTA tests, multivariate testing approaches, sample size requirements, tools and platforms, and real test results from actual chatbot optimizations. Whether you are running a lead generation bot, an e-commerce assistant, or a support chatbot, these principles will help you unlock dramatically better performance.
The compounding nature of chatbot optimization means that starting sooner matters enormously. A chatbot that begins testing in month 1 and runs one test per month steadily compounds its gains, while an identical chatbot left untested for a year leaves that performance on the table. Every month without testing is performance left unrealized. Let us fix that.
What to Test in Chatbots: A Prioritized Framework for Maximum Impact
Not all chatbot elements are equally impactful to test, a principle well-established in Optimizely's experimentation framework. Here is a prioritized framework based on observed impact magnitude, ordered from highest to lowest typical improvement potential:
Tier 1: Highest-Impact Tests
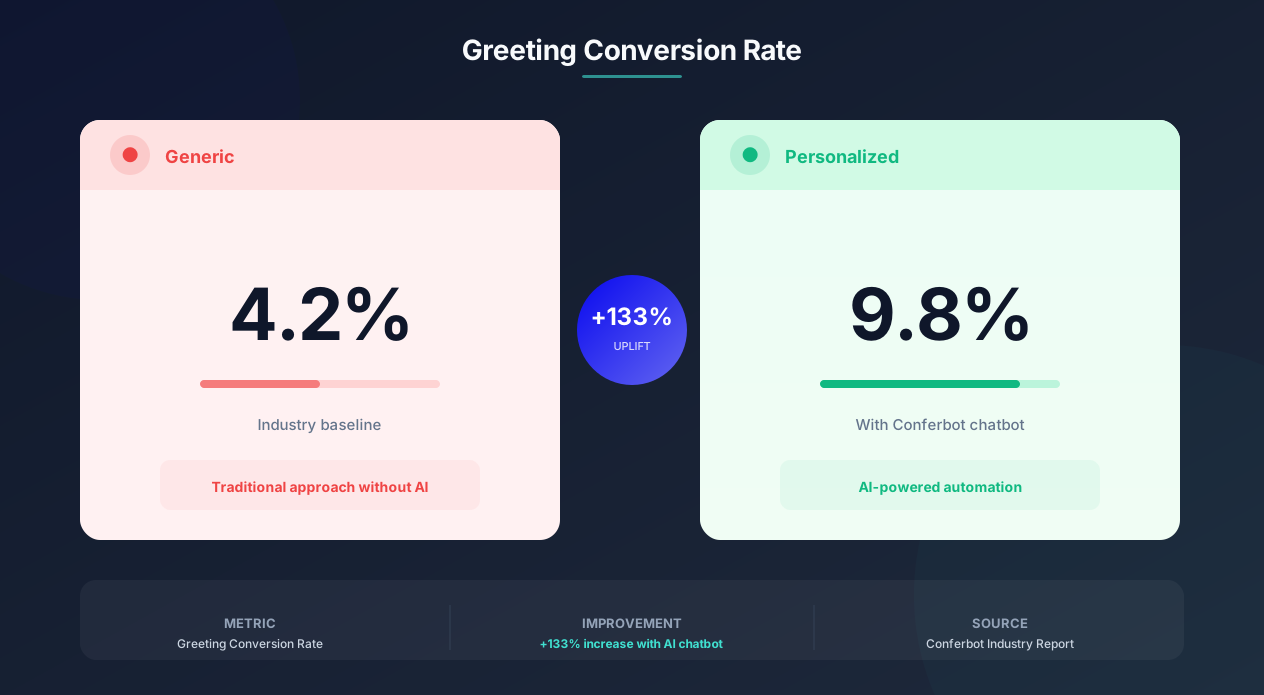
1. Greeting message: The first message determines whether visitors engage at all. Variables include message length, tone, personalization, question vs. statement format, emoji usage, and value proposition framing. This is the single most impactful test because it affects 100% of visitors who see the chatbot.
2. Trigger timing: When should the chatbot proactively appear or send its first message? Immediately on page load, after X seconds, on scroll depth, on exit intent, or only when the visitor initiates? Timing tests can swing engagement rates significantly because they determine the psychological readiness of the visitor.
3. First question or CTA: After the greeting, the first interactive element (button, quick reply, or question) determines whether the visitor continues the conversation. The specific framing, number of options, and perceived effort required all significantly impact continuation rates.
Tier 2: High-Impact Tests
4. Conversation flow length: How many steps between initial engagement and desired outcome (lead captured, meeting booked, purchase completed)? Shorter flows reduce drop-off but may sacrifice qualification quality. The optimal length varies significantly by use case and audience.
5. Question phrasing: The specific words used in chatbot questions affect response rates and quality. Open-ended vs. multiple choice, formal vs. casual, one question at a time vs. grouped - each variation can meaningfully impact flow completion rates.
6. Social proof and trust elements: Incorporating customer counts, ratings, testimonials, or security badges at key conversion moments. The placement, format, and specific proof point all affect conversion at that step.
Tier 3: Moderate-Impact Tests
7. Bot personality and tone: Formal vs. friendly, expert vs. peer, concise vs. detailed. Tone affects engagement duration and conversion differently depending on your audience segment and industry.
8. Visual design elements: Chat widget position, color, avatar, size, and animation. These affect initial click-to-open rates and brand perception but have less impact on post-engagement conversion.
9. Error handling and fallback messages: How the bot responds when it does not understand affects user persistence. Good error handling recovers the conversation; poor error handling causes abandonment.
10. Closing and follow-up: The final messages, confirmation formats, and follow-up actions affect the quality and quantity of completed conversions.
Testing Priority Matrix
| Test Element | Impact Potential | Ease of Implementation | Time to Results | Recommended Priority |
|---|---|---|---|---|
| Greeting message | Very High | Easy (text change only) | 1 to 2 weeks | 1st test to run |
| Trigger timing | Very High | Easy (config change) | 2 to 3 weeks | 2nd test |
| First CTA or question | High | Easy (text or button change) | 1 to 2 weeks | 3rd test |
| Flow length | High | Medium (flow redesign) | 3 to 4 weeks | 4th test |
| Question phrasing | High | Easy (text changes) | 2 to 3 weeks | 5th test |
| Social proof placement | Medium to High | Easy to Medium | 2 to 3 weeks | 6th test |
| Bot personality and tone | Medium | Medium (rewrite needed) | 3 to 4 weeks | 7th test |
| Visual design | Medium | Easy (config change) | 2 to 3 weeks | 8th test |
Start with Tier 1 tests and work downward. Each tier builds on the optimizations of the previous tier. Testing a CTA button before optimizing the greeting message means you are testing with a suboptimal audience (many qualified visitors never reach the CTA because the greeting failed to engage them). For comprehensive metrics to track alongside your tests, see our guide on chatbot analytics and metrics to track, and for the writing craft behind each variant, our chatbot copywriting guide.
Designing Rigorous Chatbot Experiments: Methodology That Produces Reliable Results
Chatbot A/B testing requires more rigorous experimental design than standard web testing because conversational interactions have higher variance, multiple steps, and contextual dependencies. Here is how to design experiments that produce statistically reliable results.
Defining Your Hypothesis
According to Optimizely's experimentation framework, every test begins with a clear hypothesis statement: "If we change [specific element] from [control version] to [treatment version], then [specific metric] will improve by at least [minimum effect size] because [reasoning]."
Example: "If we change the greeting from a statement ('Welcome! How can I help you?') to a question ('Looking for the right plan for your team?'), then conversation initiation rate will improve by at least 3 percentage points (from 8% to 11%) because questions create an obligation to respond and signal relevance to the visitor's intent."
A well-defined hypothesis has three components: (1) what you are changing, (2) what you expect to happen with a specific magnitude, and (3) why you expect it based on psychological principle or observed pattern.
Choosing Your Primary Metric
Each test needs one primary metric (the decision metric) and secondary metrics (for context and monitoring). Common primary metrics for chatbot tests:
- Engagement rate: Percentage of visitors who interact with the chatbot (for greeting and timing tests)
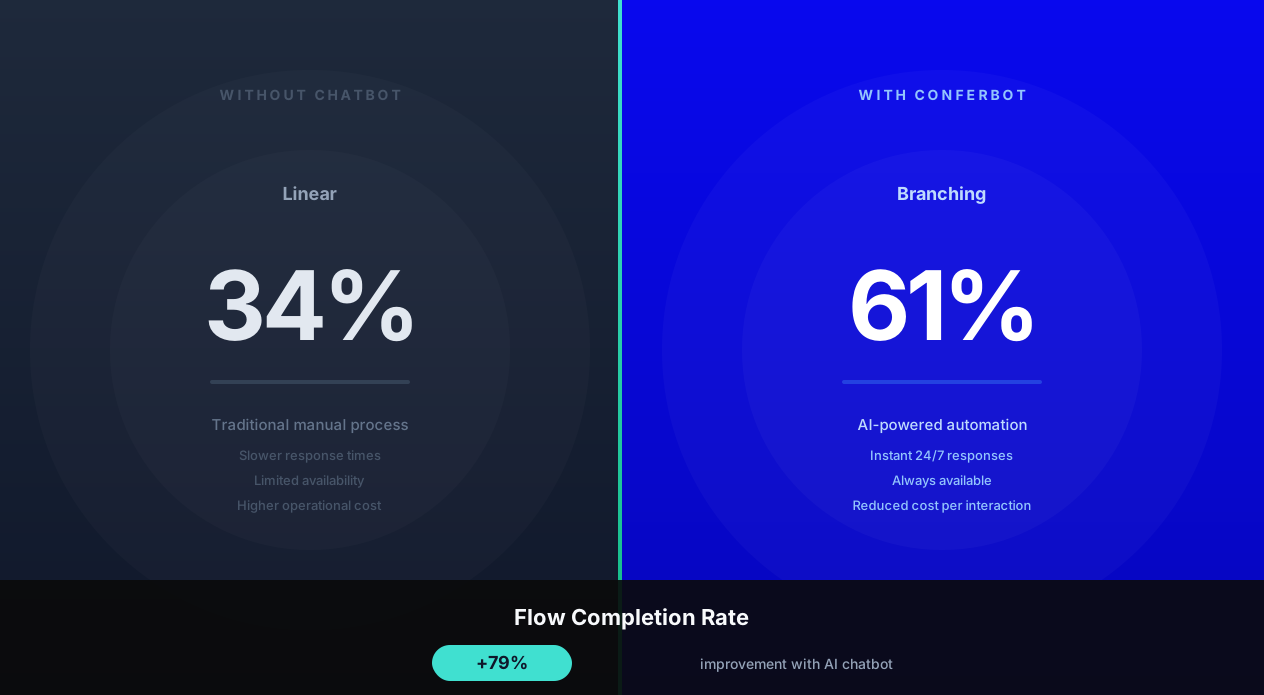
- Conversation completion rate: Percentage of engaged visitors who reach the desired endpoint (for flow tests)
- Conversion rate: Percentage of chatbot visitors who complete the business goal - lead captured, meeting booked, purchase made (for CTA and overall optimization)
- Qualified lead rate: Percentage of leads that meet qualification criteria (for qualification flow tests)
Never optimize for a metric that does not directly connect to business outcomes. Higher engagement rate is worthless if those engaged visitors do not convert. Always check secondary metrics to ensure gains in the primary metric do not come at the expense of quality.
Randomization and Split Design
Proper randomization is critical for chatbot tests:
- User-level randomization: Assign the variant at the visitor level (not the session level). If a visitor returns, they should see the same variant - seeing different greetings on different visits contaminates the data.
- Cookie or device-based assignment: Use persistent cookies or device fingerprinting to maintain consistent variant assignment across sessions.
- 50/50 split for initial tests: Start with even splits for maximum statistical power. Only use uneven splits (90/10) when you have a new variant you want to test carefully without risking too much traffic on an unproven change.
- Segment-level analysis: After the test concludes, analyze results by segment (device type, traffic source, time of day, new vs. returning visitor) to check for heterogeneous treatment effects.
Controlling for Confounding Variables
Chatbot experiments are susceptible to several confounding factors:
- Day-of-week effects: Monday traffic may behave differently than Saturday traffic. Always run tests for at least one full week (ideally two) to capture full weekly cycles.
- Seasonal effects: Holiday periods, sale events, or product launches can confound results. Avoid starting or ending tests during anomalous traffic periods.
- Traffic source shifts: If your paid campaign mix changes during a test, the different traffic quality can affect results. Monitor traffic source distribution between variants.
- Bot learning effects: If your chatbot uses AI that learns from interactions, ensure both variants use the same model state - otherwise one variant may benefit from accumulated learning.
Statistical Significance for Chatbot Tests: When Can You Trust Your Results?
One of the most common mistakes in chatbot optimization is calling a test too early. Peeking at results and stopping before reaching statistical significance - a failure mode studied extensively by teams like Microsoft's Experimentation Platform group - leads to false conclusions that can quietly reduce rather than improve performance. Given that chatbot engagement is typically a small fraction of overall page traffic, patience and proper statistical methodology are essential.
Understanding Statistical Significance
Statistical significance tells you the probability that your observed result is not due to random chance. The standard threshold is 95% confidence (p-value less than 0.05), meaning there is less than a 5% chance the observed difference occurred randomly.
For chatbot tests, we recommend 95% confidence with 80% statistical power. This means: if a true difference exists of the magnitude you specified, you have an 80% chance of detecting it, and if you declare a winner, there is only a 5% chance it was a false positive.
Sample Size Requirements
The required sample size depends on three factors: (1) your baseline conversion rate, (2) the minimum effect size you want to detect, and (3) your confidence and power requirements. Here are pre-calculated sample sizes for common chatbot testing scenarios:
| Test Type | Baseline Rate | Minimum Detectable Effect | Required Conversations per Variant | Estimated Duration (1,000 daily visitors, 10% engagement) |
|---|---|---|---|---|
| Greeting engagement | 8% | 2 percentage points (8% to 10%) | 3,900 visitors per variant | 8 days |
| Greeting engagement | 8% | 1 percentage point (8% to 9%) | 15,500 visitors per variant | 31 days |
| Conversation completion | 45% | 5 percentage points (45% to 50%) | 1,570 conversations per variant | 31 days |
| Lead conversion | 12% | 2 percentage points (12% to 14%) | 4,800 conversations per variant | 96 days |
| Lead conversion | 12% | 3 percentage points (12% to 15%) | 2,200 conversations per variant | 44 days |
| CTA click rate | 25% | 4 percentage points (25% to 29%) | 1,450 conversations per variant | 29 days |
These durations are why test prioritization matters so much. With 44 to 96 days required for conversion rate tests, you can only run 4 to 8 tests per year on that metric. Prioritize the tests most likely to produce large effects (Tier 1 from the previous section) to maximize your annual optimization gains.
Early Stopping Rules
Sometimes a test produces such dramatic results that waiting for full sample size is unnecessary. Implement these early stopping rules:
- Early winner: If one variant achieves 99.5% confidence (p less than 0.005) at the halfway point of expected duration, you can stop early and declare a winner. This threshold is higher than the final threshold to account for the multiple-testing problem of peeking at results.
- Early loser: If one variant is performing dramatically worse (confidence greater than 99% that it is inferior), stop the test to avoid unnecessary cost to your business. There is no ethical reason to continue sending traffic to a clearly inferior experience.
- Futility stop: If at the 75% mark there is less than a 10% probability that the test will reach significance, it is likely underpowered for the actual effect size. Stop and redesign with a larger effect hypothesis or more traffic.
Common Statistical Mistakes to Avoid
- Peeking without correction: Checking results daily without adjusting your significance threshold inflates your false positive rate. Either pre-commit to a fixed sample size or use sequential testing methods (like Bayesian approaches) designed for continuous monitoring.
- Ignoring practical significance: A result can be statistically significant but practically meaningless. A 0.3 percentage point improvement that is statistically significant might not be worth implementing if the engineering effort outweighs the business impact.
- Testing too many variants: Each additional variant requires more traffic to reach significance. For chatbot tests where traffic is limited, stick to two variants (A/B) rather than three or four (A/B/C/D).
Greeting Message Tests: The Highest-Impact Starting Point
The greeting message is the single most impactful element to test because it determines whether visitors engage at all. A great greeting can dramatically increase engagement; a poor one ensures most visitors never interact with your chatbot regardless of how well-designed the subsequent conversation is. See our conversation design masterclass for the principles behind what makes a greeting work.
Greeting Variables to Test
1. Question vs. Statement:
- Statement: "Hi! Welcome to Conferbot. We help businesses build better chatbots."
- Question: "Hi! Are you looking to increase your conversion rates with chatbot automation?"
Questions consistently outperform statements in engagement rate because they create a psychological obligation to respond and signal that the chatbot will provide relevant help rather than generic messaging.
2. Specific vs. Generic:
- Generic: "How can I help you today?"
- Specific: "Want to see how much revenue a chatbot could generate for your store?"
Specific greetings that reference the visitor's likely intent (based on page context) meaningfully outperform generic greetings. A visitor on a pricing page responds better to "Have questions about our plans?" than to "How can I help you?"
3. Short vs. Long:
- Short: "Need help choosing a plan?"
- Long: "Hi there! I am the Conferbot assistant. I can help you compare plans, answer questions about features, or connect you with our sales team. What would be most helpful?"
On mobile, shorter greetings (under 20 words) typically win. On desktop, slightly longer greetings (20 to 40 words) perform well because screen real estate is less constrained. Always test both.
4. Personalized vs. Universal:
- Universal: "Welcome! How can I help?"
- Personalized: "Welcome back, Sarah! You were looking at our Enterprise plan last time. Ready to continue?"
Personalized greetings for returning visitors tend to achieve markedly higher engagement than generic ones. However, personalization requires visitor identification (logged in, cookie-based recognition), so it applies only to a subset of traffic.
Patterns That Consistently Show Up in Greeting Tests
Across greeting tests, a handful of directional patterns hold up reliably. A question-based greeting ("Looking for the right chatbot solution?") tends to beat a generic statement ("We are here to help.") because it creates an implicit prompt to respond. A page-specific greeting that references what the visitor is likely looking at (a pricing-page greeting that asks about pricing) tends to beat a one-size-fits-all greeting for the same reason. Referencing social proof - the fact that other businesses use the product - tends to add a modest lift on top of either. Small polish details like an emoji tend to move the needle the least of the variables tested. The largest, most consistent gains tend to come from leading with a specific, concrete benefit and closing with a question that invites engagement, rather than opening with an open-ended "how can I help" that gives the visitor no reason to respond.
The mechanism behind this pattern is straightforward: a greeting that communicates specific value and creates curiosity gives the visitor a reason to engage, while a generic greeting does not. Test your own greeting variants against this pattern before assuming any specific number transfers to your audience - the ranking of which variable matters most is far more transferable than any single test's magnitude.
Page-Specific Greeting Strategy
Rather than testing one universal greeting, the highest-performing chatbots use page-specific greetings that match the visitor's context. Here are framework recommendations by page type, validated through multiple tests. For more tested chatbot approaches, see our chatbot best practices guide:
- Homepage: Broad value proposition + navigation question: "We help businesses automate customer conversations. Are you looking for sales, support, or marketing automation?"
- Pricing page: Purchase-intent framing: "Comparing plans? I can help you find the right fit for your team size and needs."
- Product page: Feature-specific help: "Want to see how our lead qualification feature works? I can give you a quick demo."
- Blog post: Content-related deepening: "Enjoying this article? I can answer specific questions about implementing these strategies."
- Case studies page: Outcome-focused: "Want results like these for your business? Tell me about your use case and I will show you what is possible."
Flow Branching Tests: Optimizing Conversation Paths for Completion
Once visitors engage with your chatbot, the conversation flow determines whether they reach the desired outcome (lead captured, meeting booked, issue resolved). Flow testing optimizes the path between engagement and conversion - every branch point, every question, and every transition represents an optimization opportunity.
Flow Length Testing
The number of steps in your conversation flow directly impacts completion rate. Each additional step creates a drop-off point where visitors disengage. However, too few steps may sacrifice qualification quality or fail to build enough trust for conversion.
| Flow Length | Relative Completion Rate | Lead Quality | Best Use Case |
|---|---|---|---|
| 2 to 3 steps | Highest | Lower (less qualified) | Email capture, newsletter signup, basic info |
| 4 to 5 steps | High | Medium | Lead qualification, product recommendations |
| 6 to 8 steps | Moderate | Higher (well qualified) | Complex sales qualification, detailed assessment |
| 9 to 12 steps | Lowest | Highest | Detailed consultation, insurance quotes, mortgage applications |
The optimal length depends on what you are optimizing for. If volume matters most (maximizing total leads), shorter flows win. If quality matters most (maximizing sales-ready leads), longer flows that qualify thoroughly produce better downstream conversion rates. Test to find your specific optimum by measuring not just completion rate but downstream conversion to revenue.
Question Order Testing
The sequence of questions matters. Research in survey methodology shows that question order affects both response rates and response quality. For chatbot flows:
Easy-first principle: Based on behavioral research on commitment and consistency published in Organizational Behavior and Human Decision Processes, start with low-effort questions (multiple choice, yes/no) and progress to higher-effort questions (open text, detailed information). Tests consistently show meaningfully higher completion rates when easy questions come first, because momentum builds commitment.
Value-before-ask principle: Provide value before requesting information. A chatbot that gives a product recommendation before asking for an email tends to convert noticeably better than one that asks for an email before providing value. The visitor must feel they are getting something in exchange for their information.
Logical grouping: Questions that logically relate should be adjacent. Jumping between topics (company size, then product interest, then company size again) creates confusion and increases drop-off.
Branch Point Optimization
Branch points are where the conversation diverges based on user responses. Each branch should feel natural and lead to relevant follow-up content. Test these branch variables:
- Number of branch options: 2 options vs. 3 vs. 4 vs. 5. Generally, 2 to 3 options perform best in chatbot contexts (lower cognitive load than web forms with many options).
- Option labeling: Short labels vs. descriptive labels. "Small" vs. "Small (1 to 10 employees)" - the descriptive version reduces confusion and improves routing accuracy.
- Free-text vs. structured: For some questions, letting users type freely produces richer data but lower completion. Offering quick-reply buttons with an "Other" option provides structure while allowing flexibility.
Patterns That Consistently Emerge From Flow Testing
A few directional patterns hold up reliably across flow tests. Shortening a lead-capture flow from five steps to three tends to increase completion meaningfully, though the leads that come through a shorter flow are typically less qualified on average - a real tradeoff between volume and quality, not a pure win. Asking for an email address only after providing value (a recommendation, an answer, a quote) rather than before it tends to convert better with little to no drop in lead quality, since the visitor has already received something in return for the information. Splitting a two-question message into two single-question messages typically improves completion, since visitors process one decision at a time more easily than several bundled together. And a simple progress indicator ("Step 2 of 4") tends to modestly reduce abandonment by setting an expectation for how much effort remains.
The value-first pattern is particularly instructive: it is one of the few changes that improves lead volume without degrading lead quality, since it represents purely incremental conversions that would otherwise have been lost to the email-first approach. For ready-to-use flow templates, see our copy-paste chatbot flow guide, and for a deeper walkthrough of flow design principles, our conversation flow optimization guide.
CTA Optimization: Testing Calls-to-Action for Maximum Click-Through
The call-to-action is the moment of truth in your chatbot conversation - the point where you ask the visitor to take the action that creates business value. CTA testing focuses on maximizing the percentage of visitors who reach this point and then take the desired action.
CTA Variables to Test
1. Button text: The specific words on your CTA button or quick reply have outsized impact on click rates. Test variations across these dimensions:
- Action-oriented vs. benefit-oriented: "Book a Demo" vs. "See It in Action"
- First person vs. second person: "Get My Free Trial" vs. "Get Your Free Trial"
- Specific vs. vague: "Start 14-Day Free Trial" vs. "Get Started"
- Urgency vs. standard: "Claim My Spot (3 left today)" vs. "Sign Up"
2. Number of CTAs: Testing one final CTA vs. multiple CTA options at the conversion point. "Book a Demo" alone vs. "Book a Demo" + "Start Free Trial" + "Download Guide" - multiple options catch different intent levels but can create indecision.
3. CTA placement timing: When in the conversation does the primary CTA appear? After qualification questions? After providing value? Immediately? The right timing depends on how much trust and interest has been built.
4. Surrounding context: What the bot says immediately before the CTA affects its persuasiveness. Test different lead-in messages: social proof ("500 companies started their free trial this week"), urgency ("Limited spots available for this month"), or value recap ("Based on what you told me, here is what Conferbot can do for you: [benefits]").
Patterns That Consistently Emerge From CTA Testing
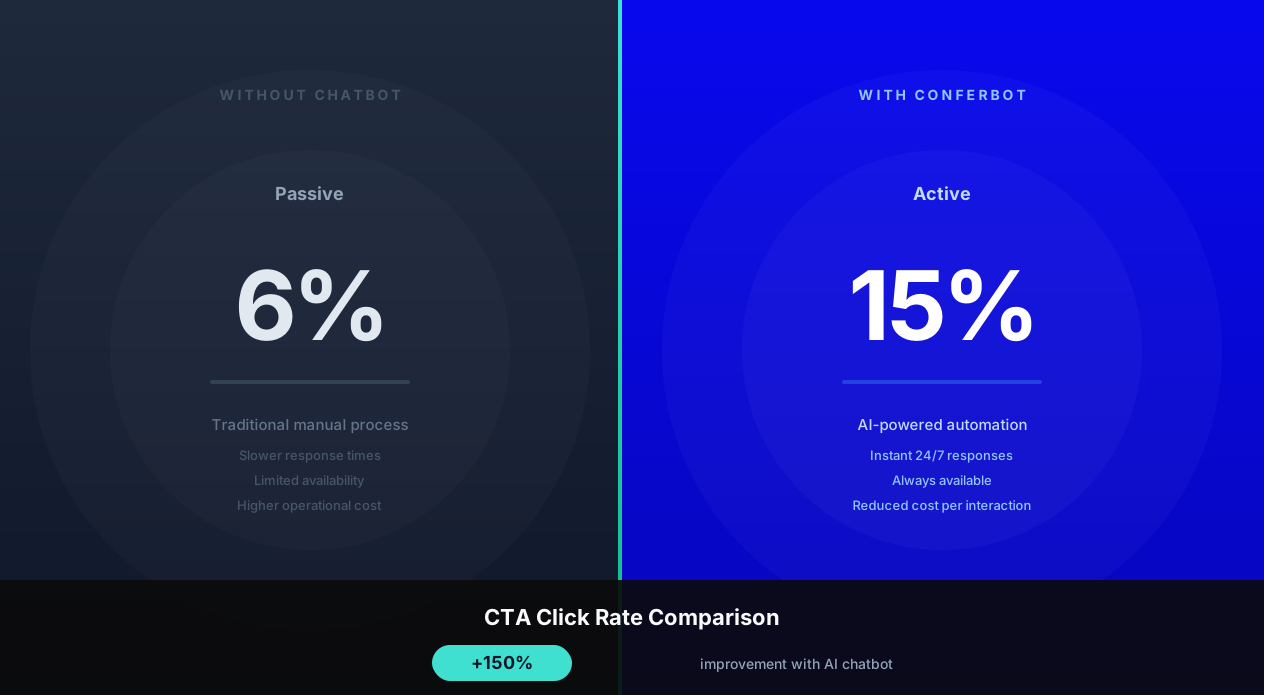
Several directional patterns show up reliably across CTA tests. Specificity tends to win - "See My Custom Plan" tends to outperform "Learn More" because it communicates exactly what the visitor will get, while a vague CTA leaves the benefit to the visitor's imagination. First-person possessive language ("Get My Report" rather than "Get Your Report") tends to create a small but consistent lift, likely from the ownership psychology it implies. Adding a short value recap or a note of social proof immediately before the CTA tends to outperform presenting the CTA with no lead-in. And reducing the perceived commitment of the ask - "Quick 10-min Chat (no commitment)" versus "Schedule a Call" - tends to produce one of the larger lifts of any CTA variable, because it directly lowers the friction barrier the visitor has to clear.
CTA Optimization for Different Chatbot Goals
The optimal CTA strategy varies by business objective:
- Lead generation: Test progressive commitment - offer a low-friction first CTA (download guide) that leads to a higher-friction second CTA (book demo) after the lead has engaged with the content.
- E-commerce: Product-specific CTAs outperform generic ones. "Add the Blue Running Shoe to Cart" tends to outperform "Add to Cart" in chatbot contexts because it confirms the specific action.
- SaaS trial: Time-bound free trials outperform indefinite ones in CTA. "Start 14-Day Free Trial" tends to outperform "Start Free Trial" because the time limit creates urgency without requiring commitment.
- Appointment booking: Showing available times in the CTA reduces friction. "Book Thursday at 2 PM" tends to outperform "Schedule a Time" because it eliminates the mental effort of choosing a time. For more on qualification strategies before the CTA, see our chatbot lead qualification guide, and for the UI patterns that support strong CTA presentation, our chatbot UI design best practices.
Multivariate Testing: Testing Multiple Elements Simultaneously
Once you have optimized individual elements through A/B testing, multivariate testing (MVT) - as documented by Nielsen Norman Group's UX research - allows you to test combinations of elements simultaneously and identify interaction effects - cases where the combination of two changes produces a different result than either change alone.
When to Use Multivariate vs. A/B Testing
Use A/B testing when:
- You are testing one variable at a time (greeting message OR timing, not both)
- Your traffic volume is moderate (under 5,000 daily engaged conversations)
- You want clear, simple results that are easy to interpret and implement
- You are in early optimization stages and have not yet found your baseline winners
Use multivariate testing when:
- You want to test interactions between multiple elements simultaneously
- Your traffic volume is high (over 5,000 daily engaged conversations)
- You have already optimized individual elements and want to find optimal combinations
- You suspect certain combinations work better together than individually
MVT Design for Chatbots
A common chatbot MVT design tests combinations of greeting, first question, and CTA simultaneously. With 2 variations of each, you get 2 x 2 x 2 = 8 combinations. Each combination needs sufficient traffic for significance, so total traffic requirements are 8x a simple A/B test.
Example MVT design:
| Combination | Greeting | First Question | CTA |
|---|---|---|---|
| 1 (Control) | Generic statement | Open-ended question | "Book Demo" |
| 2 | Generic statement | Open-ended question | "Quick 10-min Chat" |
| 3 | Generic statement | Multiple choice buttons | "Book Demo" |
| 4 | Generic statement | Multiple choice buttons | "Quick 10-min Chat" |
| 5 | Value proposition question | Open-ended question | "Book Demo" |
| 6 | Value proposition question | Open-ended question | "Quick 10-min Chat" |
| 7 | Value proposition question | Multiple choice buttons | "Book Demo" |
| 8 (Full treatment) | Value proposition question | Multiple choice buttons | "Quick 10-min Chat" |
Interpreting MVT Results
MVT analysis reveals two types of effects:
Main effects: The average impact of each variable across all combinations. For example, a "value proposition greeting" might outperform a "generic statement greeting" on average, regardless of what first question or CTA is paired with it.
Interaction effects: Cases where the combination matters more than either change alone. A value-proposition greeting paired with multiple-choice buttons might outperform what you would predict from adding their individual effects together - the interaction creates synergy that single-variable testing would miss.
In practice, interaction effects account for a meaningful but secondary share of the total optimization opportunity - worth pursuing once you have high enough traffic to run MVT, but not worth the additional complexity and traffic requirements for lower-traffic implementations. Start with sequential A/B testing to capture the bulk of the value, which tends to come from main effects, then move to MVT for the final optimization layer.
Sample Size and Duration Calculators: Planning Your Testing Roadmap
Knowing how long each test will take allows you to plan an annual testing roadmap. The Harvard Business Review's analysis of online experimentation emphasizes that proper pre-test planning - including duration and sample size calculation - is the single most important factor separating successful testing programs from failed ones and set stakeholder expectations. Here is a framework for calculating test duration based on your specific traffic and engagement metrics.
Sample Size Formula
The required sample size per variant for a two-proportion z-test is determined by your baseline rate, minimum detectable effect, significance level (alpha), and power (1 minus beta). For practical planning, use these pre-calculated tables.
Duration Calculator by Traffic Profile
| Your Daily Visitors | Chatbot Engagement Rate | Daily Conversations | Duration for Engagement Test (2pp MDE) | Duration for Conversion Test (3pp MDE) |
|---|---|---|---|---|
| 500 | 8% | 40 | 195 days (not feasible) | 73 days |
| 1,000 | 8% | 80 | 98 days | 37 days |
| 2,000 | 10% | 200 | 39 days | 15 days |
| 5,000 | 10% | 500 | 16 days | 6 days |
| 10,000 | 12% | 1,200 | 7 days | 3 days |
| 25,000 | 12% | 3,000 | 3 days | 2 days |
Note: MDE = Minimum Detectable Effect (the smallest improvement you would consider meaningful). pp = percentage points. Assumes 95% confidence and 80% power with a 50/50 traffic split.
Planning an Annual Testing Roadmap
Based on your test duration capabilities, plan your annual testing schedule:
High-traffic sites (over 5,000 daily visitors): Run 20 to 30 tests per year (one every 1 to 2 weeks). Sequence: 4 greeting tests, 4 timing tests, 4 flow tests, 4 CTA tests, 4 multivariate tests, and 4 to 10 miscellaneous refinement tests.
Medium-traffic sites (1,000 to 5,000 daily visitors): Run 8 to 12 tests per year (one every 3 to 5 weeks). Sequence: 2 greeting tests, 2 timing tests, 2 flow tests, 2 CTA tests, and 2 to 4 refinement tests. Prioritize ruthlessly - only test variables with the highest expected impact.
Low-traffic sites (under 1,000 daily visitors): Run 4 to 6 tests per year (one every 2 to 3 months). Focus exclusively on Tier 1 tests (greeting, timing, primary CTA) where the large effect sizes can be detected with limited traffic. Consider using Bayesian methods which can provide useful directional information with smaller samples.
Alternative Approaches for Low-Traffic Chatbots
If your traffic does not support traditional frequentist A/B testing, consider these alternatives:
- Bayesian testing: Provides probability distributions rather than binary significant/not-significant outcomes. You can make decisions with smaller samples by accepting a probability threshold (e.g., 90% probability of being better) rather than a fixed significance level.
- Before/after comparison: Implement a change and compare metrics from the same period (same days of week, similar traffic sources) before and after. Less rigorous than randomized testing but provides directional guidance with any traffic level.
- Qualitative testing: Review conversation transcripts manually. Read 50 conversations with each variant and assess quality, engagement, and outcome. This qualitative analysis can complement quantitative data when sample sizes are small.
Tools and Platforms for Chatbot A/B Testing
The right tools make chatbot testing practical and rigorous. Here is an overview of available approaches, from built-in platform features to custom analytics setups.
Native Chatbot Platform Testing
Many chatbot platforms include built-in A/B testing capabilities:
Conferbot: Built-in variant testing for greetings, flows, and CTAs with automatic traffic splitting and significance calculation. The platform handles randomization, variant assignment persistence, and results analysis - no external tools needed. Configure tests through the visual flow builder by creating variant branches and assigning traffic percentages.
Advantages of native testing:
- Zero integration effort - testing is built into the same tool you use to build the chatbot
- Automatic variant assignment and persistence
- Metrics specific to chatbot interactions (conversation completion, message-level drop-off, qualification rate)
- One-click winner deployment without needing to recreate the winning variant
External Analytics Integration
For deeper analysis, integrate your chatbot with external analytics platforms:
- Google Analytics 4: Track chatbot events (engagement, completion, conversion) as custom events. Use GA4's built-in experimentation features for cross-platform analysis.
- Mixpanel or Amplitude: Funnel analysis for chatbot conversation steps, cohort analysis for long-term impact, and retention tracking for returning visitor engagement.
- Hotjar or FullStory: Session recordings that show the full visitor journey including chatbot interactions - invaluable for understanding why users drop off at specific points.
Statistical Analysis Tools
For rigorous significance testing beyond what platform dashboards provide:
- Online calculators: Evan Miller's sample size calculator for pre-test planning, and his significance calculator for post-test analysis. These are the industry standard for frequentist analysis.
- Bayesian tools: For continuous monitoring without the peeking problem. VWO's Bayesian engine and Google Optimize (now integrated into GA4) provide probability-based results.
- Custom analysis: For teams with data science resources, Python (scipy.stats) or R provide maximum flexibility for complex analyses including segmentation, interaction effects, and time-series analysis of test results.
Testing Workflow Recommendation
Our recommended workflow for most teams:
- Use Conferbot's native A/B testing for implementation and traffic splitting
- Define significance thresholds and sample sizes before starting (use Evan Miller's calculator)
- Monitor daily through the Conferbot dashboard for gross issues (one variant crashing, extreme imbalance)
- Wait for the pre-determined sample size before analyzing results
- Document results in a shared testing log with hypothesis, result, confidence level, and learnings
- Deploy winner and queue next test
Illustrative Optimization Walkthroughs: How Sequential Testing Compounds
Here is what a realistic sequential optimization program looks like in practice, following the iterative methodology recommended by WiderFunnel's experimentation platform - illustrative walkthroughs of how systematic testing compounds chatbot performance from initial launch toward an optimized state, rather than reports of a specific company's results.
Illustrative Walkthrough 1: A Lead Generation Bot's Testing Sequence
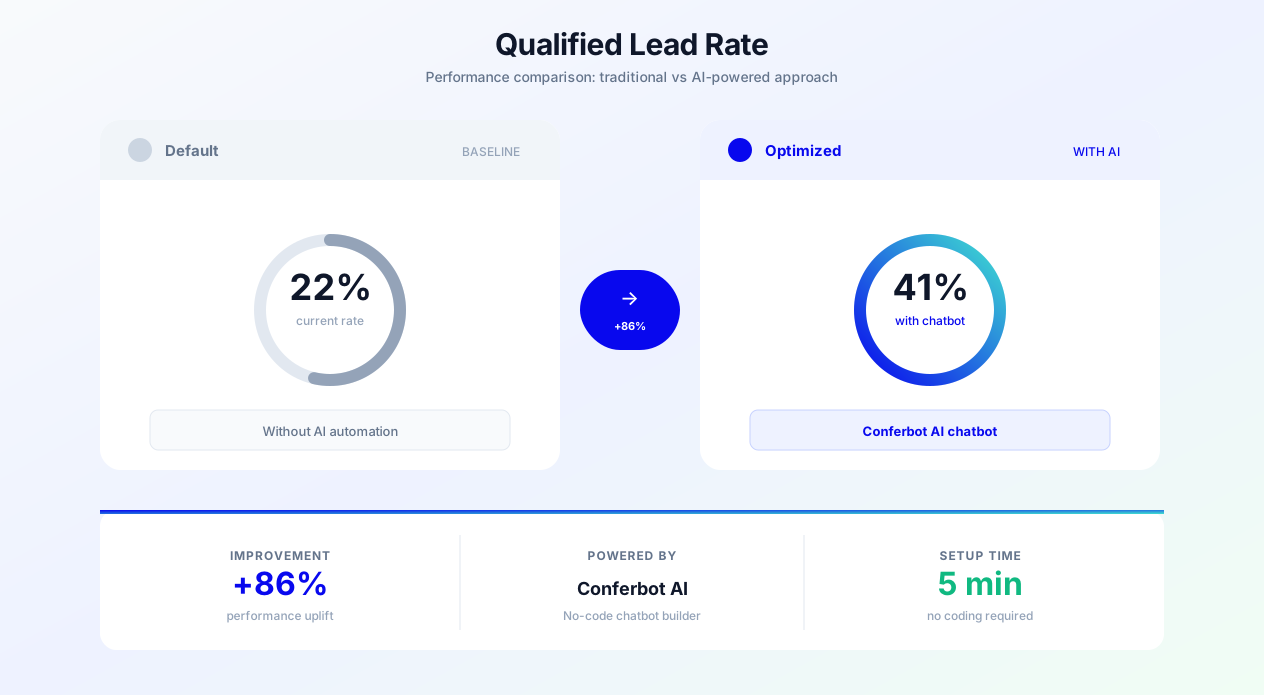
Picture a B2B SaaS company that launches a chatbot for lead generation with a modest starting lead capture rate. Over a six-month program it works through the priority order described earlier in this guide:
Test sequence:
- Greeting test (month 1): statement swapped for a question. Lead capture rate improves.
- Trigger timing test (month 2): immediate pop-up replaced with a short delay. Rate improves again.
- Flow length test (month 3): a long qualification flow trimmed down. Another gain.
- CTA test (month 4): a low-commitment CTA replaces a formal "Book Demo" ask. Further gain.
- Social proof test (month 5): a customer-count mention added before the CTA. A smaller, incremental gain.
- Value-first flow test (month 6): the flow now recommends before it asks for an email. One more incremental gain.
Each individual test in this sequence typically produces a modest improvement on its own, but compounded together across six sequential tests they add up to a substantial improvement in overall lead capture rate. This is the core argument for testing continuously rather than running one optimization project and stopping: consistent testing over time produces dramatically better results than any single optimization effort, because each win becomes the new baseline the next test builds on.
Illustrative Walkthrough 2: An E-Commerce Chatbot's Testing Sequence
An e-commerce store's chatbot might follow a similar arc: a personalized greeting based on the product page a visitor is viewing, followed by higher-quality product recommendations, a bundle CTA that shows the savings explicitly, and an exit-intent flow that offers help before an abandoning visitor leaves. Each step compounds on the last, and the chatbot's contribution to revenue grows substantially over the four-month program - again, through a sequence of individually modest wins rather than one large change.
Illustrative Walkthrough 3: A Support Bot's Deflection Testing Sequence
A customer support chatbot deflecting a portion of tickets at launch might improve deflection through clearer initial problem categorization, a step-by-step knowledge base answer format instead of dense paragraphs, an explicit confirmation question ("Did this solve your issue?") that catches unresolved cases before they are logged as deflected, and a better-routed fallback path when the bot cannot help. The combined effect across all four changes is typically a meaningful increase in ticket deflection, which translates directly into lower support cost per ticket even though no single change in the sequence was dramatic on its own.
Patterns Across All Three Walkthroughs
A few patterns consistently appear across chatbot optimization programs structured this way:
- The first two or three tests tend to produce the largest gains, since they target the highest-leverage elements (greeting, timing, flow length) identified in the prioritization framework above. Subsequent tests yield diminishing but still meaningful returns.
- Question-based greetings consistently outperform statement-based greetings across programs. It is worth testing first for exactly this reason.
- Shorter flows outperform longer flows on volume metrics; longer flows win on quality metrics. The business priority determines which is optimal for a given chatbot.
- Personalization consistently lifts engagement enough to be worth the implementation effort in most programs.
- Reducing perceived commitment in CTA language is one of the more reliable levers across programs.
- Social proof has a modest but reliable positive impact and is nearly always worth adding once the higher-leverage tests are done.
For more foundational chatbot strategies to test, see our conversational marketing chatbot guide and our guide to chatbot human handoff best practices for optimizing the fallback path referenced in the support bot walkthrough above.
Building a Continuous Chatbot Optimization Culture
The most successful chatbot implementations are not built once and left - they are continuously optimized through a systematic testing culture. Here is how to build that culture within your organization.
The Testing Flywheel
Effective chatbot optimization follows a four-phase flywheel:
Phase 1: Observe. Monitor chatbot analytics to identify the weakest link in the conversation funnel. Where is the biggest drop-off? Which messages have the lowest response rates? Where do visitors abandon? Data identifies the optimization opportunity with the highest potential impact.
Phase 2: Hypothesize. Based on the observed weakness, develop a specific hypothesis about what change will improve the metric and why. Ground hypotheses in psychological principles (social proof, reciprocity, commitment, scarcity) or observed user behavior patterns (transcript analysis revealing confusion or friction).
Phase 3: Test. Implement the experiment with proper methodology: clear primary metric, adequate sample size, statistical rigor, and pre-committed duration. Run the test without peeking until the predetermined sample is reached.
Phase 4: Learn. Analyze results, document learnings (both wins and losses), update your mental model of what works for your audience, and feed insights back into Phase 1 to identify the next opportunity.
Documentation and Knowledge Management
Maintain a testing log that documents every experiment:
| Field | Purpose | Example |
|---|---|---|
| Test name | Quick identification | "Greeting: Question vs. Statement" |
| Hypothesis | Why you expect this to work | "Questions create obligation to respond" |
| Primary metric | Decision metric | Engagement rate |
| Start and end dates | Duration tracking | May 1 to May 15, 2026 |
| Sample size | Statistical validity | 8,500 visitors per variant |
| Result | Outcome data | Treatment won at 98% confidence |
| Learning | Generalizable insight | "Page-specific questions outperform generic on all page types tested" |
| Next action | What to test next based on this result | "Test different question formats on pricing page" |
Over time, this log becomes a priceless asset - a cumulative record of what works and what does not for your specific audience, product, and context. New team members can review the history and avoid repeating failed experiments or contradicting proven winners.
Organizational Buy-In
Building a testing culture requires organizational support:
- Share results broadly: Send monthly optimization reports showing cumulative improvement and business impact. When stakeholders can see the compounding gains from a sequence of tests, they advocate for continued investment.
- Celebrate learning, not just winning: A test that loses (the treatment performs worse than control) is still valuable - it tells you what NOT to do and refines your model. Never punish team members for tests that do not produce lifts.
- Set quarterly testing goals: Rather than ad-hoc testing, commit to a specific number of tests per quarter (e.g., 4 to 6) with dedicated time for analysis and implementation.
- Calculate cumulative impact: Track the compound improvement from all tests to date. Being able to say "our chatbot performs meaningfully better than at launch thanks to systematic testing, and here is the sequence of tests that got us there" is a powerful narrative for continued investment.
How Conferbot Makes A/B Testing Simple and Rigorous
Conferbot includes purpose-built A/B testing capabilities designed specifically for conversational interfaces - no external tools, no custom code, no statistical expertise required.
Visual Variant Builder
Create test variants directly in the flow builder. Duplicate a flow into up to four variants (A, B, C, and D), assign a traffic weight to each, and mark one as the control - all without touching code.
Automatic Statistical Analysis
Conferbot calculates statistical significance automatically using a two-proportion z-test for rate-based metrics like completion rate and conversion rate, and a relative-difference comparison for metrics like average session duration, CSAT score, and leads collected. Each experiment has a configurable confidence threshold and a minimum number of sessions per variant before a winner can be considered, plus a maximum wait time after which an inconclusive test is flagged rather than left running indefinitely.
Conversation-Level Metrics
Unlike generic A/B testing tools, Conferbot tracks metrics specific to conversations for each variant: completion rate, drop-off rate, conversion rate, average session duration, average CSAT score, and leads collected. This granular data helps you understand not just whether a variant wins, but why it wins - information that informs your next test hypothesis.
Persistent Variant Assignment
Each visitor is assigned to a variant using a consistent hash of their visitor identity and the experiment, so the same visitor sees the same variant across sessions - eliminating the novelty effect that can confound results when visitors see different experiences on different visits.
Winner Deployment
When a test reaches the confidence threshold, Conferbot can declare a winner automatically or you can declare one manually, then apply the winning flow version to your live chatbot. The losing variant's flow version stays available so you can reference it in your testing log or revert if needed.
Getting Started
With significance testing handled for you, chatbot optimization becomes a systematic, accessible practice rather than a complex statistical exercise. Start with a single high-impact test - your greeting message is the best place to begin, per the prioritization framework earlier in this guide - and build the compounding improvement cycle that separates high-performing chatbots from average ones. See our chatbot performance monitoring guide for what to watch once a test is live.
Was this article helpful?
Build and deploy in 10 minutes. No coding needed.
Chatbot A/B Testing FAQ
Everything you need to know about chatbots for chatbot a/b testing.
About the Author
The Conferbot team writes about building, deploying, and improving AI chatbots.
View all articles