
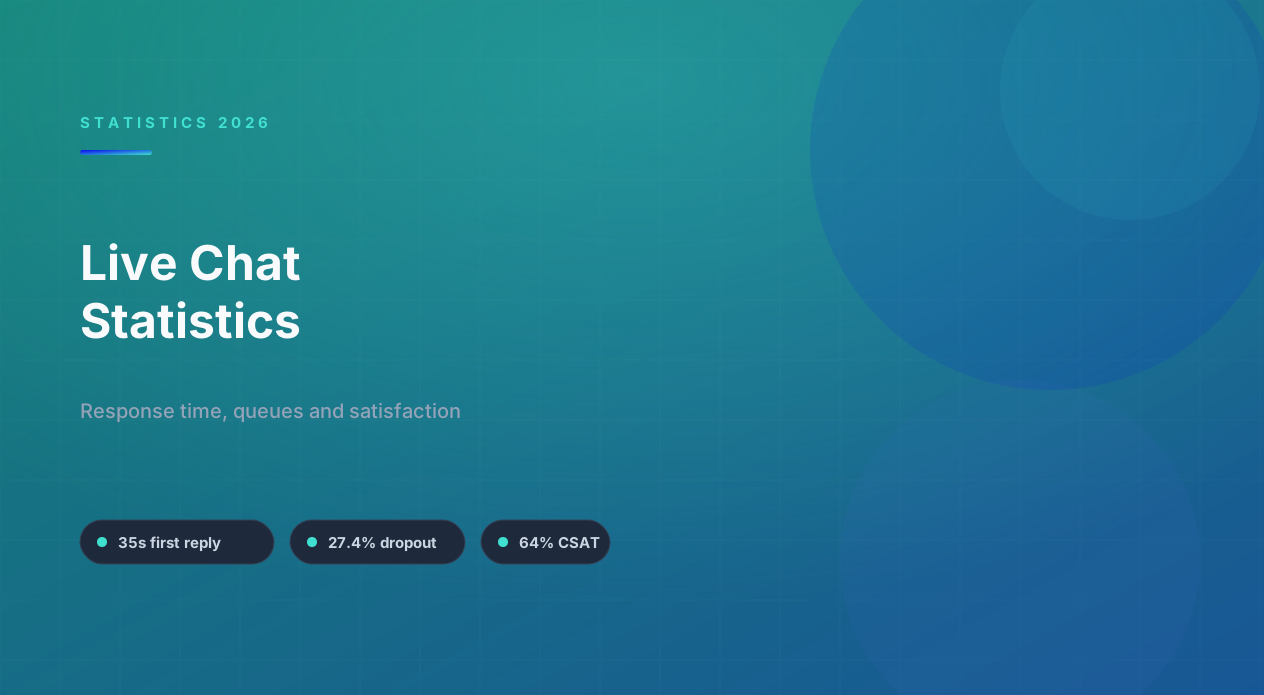
Live chat benchmarks at a glance
34 live chat statistics, every one linked to its source. The core benchmarks come from LiveChat's Customer Service Report, which analyzed 1.67 billion chats, 87 billion website visits and 12 million tickets. LiveChat says the data was last updated in 2024, so we label it that way. Customer expectations come from Zendesk's CX Trends 2026, Gartner and Salesforce.
| Benchmark | Value | Source |
|---|---|---|
| First response time | 35 seconds | LiveChat, 2024 data |
| Queue wait before an agent | 4 minutes 18 seconds | LiveChat, 2024 data |
| Queue dropout | 27.4% | LiveChat, 2024 data |
| CSAT, all rated chats / chatbot chats | 64.2% / 64.7% | LiveChat, 2024 data |
| Chats on mobile | 94.2% | LiveChat, 2024 data |
| Consumers expecting 24/7 service | 74% | Zendesk, Nov 2025 |
The gap these numbers describe is not response speed: 35 seconds is fast. It is everything after the first reply. More than one in four customers leave the queue before reaching a person, the average wait is over four minutes, and businesses are staffed for about 18 hours a day while three quarters of consumers expect 24.
Download the data (CSV) with source URLs and dates for every row.
Response time and queue statistics
| Statistic | What it measures | Source |
|---|---|---|
| 35 seconds | Typical first response time on LiveChat across all businesses | LiveChat Customer Service Report (2026 data), 2026 |
| 4m 18s | Average time customers waited in a queue before reaching an agent | LiveChat Customer Service Report (2026 data), 2026 |
| 27.4% | Customers who left the queue before being served | LiveChat Customer Service Report (2026 data), 2026 |
| 8m 25s | Average duration of a single chat | LiveChat Customer Service Report (2026 data), 2026 |
| 17h 58m | Average hours per day businesses kept chat available | LiveChat Customer Service Report (2026 data), 2026 |
| 31s vs 1m 22s | First response time at businesses with 1 to 9 employees versus 50 to 99 (retail section) | LiveChat Customer Service Report (2026 data), 2026 |
A 35-second first response is the benchmark to beat, and small teams beat it: LiveChat found businesses with one to nine employees answer in 31 seconds on average, while those with 50 to 99 take 1 minute 22 seconds. Growth adds routing and handoffs, and those add delay.
The queue numbers are the bigger problem. A 27.4% dropout rate means more than a quarter of the people who wanted to talk to you gave up. That is the strongest argument for a bot in front of live chat: not to replace agents, but to answer the simple questions instantly so the queue only holds people who need a person. Our guide to chatbot vs live chat costs works through the trade-off, and the first response time glossary entry explains how to measure it consistently.
Chat volume and agent workload
| Statistic | What it measures | Source |
|---|---|---|
| 1.67 billion | Chats handled by businesses on LiveChat in the report period | LiveChat Customer Service Report (2026 data), 2026 |
| 6,794 | Average chats per business per month | LiveChat Customer Service Report (2026 data), 2026 |
| 84.1 | Chats handled per agent per day | LiveChat Customer Service Report (2026 data), 2026 |
| 11h 48m | Average daily time an agent spends actively chatting | LiveChat Customer Service Report (2026 data), 2026 |
| 94.2% | Share of chats that happened on mobile devices | LiveChat Customer Service Report (2026 data), 2026 |
| 6.7% | Share of chats that customers rated | LiveChat Customer Service Report (2026 data), 2026 |
An agent handling 84 chats in a day while spending almost twelve hours actively chatting is not a sustainable average for a small team. It reflects concurrency: experienced agents run several chats at once. That works for quick questions and fails for complex ones, which is where the 12 million follow-up tickets come from.
The mobile number matters for design. With 94.2% of chats on phones, a widget that covers the screen, a pre-chat form with six fields or a slow-loading script costs you conversations. Our chatbot window design guide and the chat widget designer help you check how yours looks on a small screen, and the website chatbot preview shows it on your own site.
Live chat satisfaction and the role of bots
| Statistic | What it measures | Source |
|---|---|---|
| 64.2% | Average CSAT across rated chats | LiveChat Customer Service Report (2026 data), 2026 |
| 64.7% | CSAT for chats handled by chatbots | LiveChat Customer Service Report (2026 data), 2026 |
| 163 million | Chats that involved a chatbot, against 1.51 billion handled only by people | LiveChat Customer Service Report (2026 data), 2026 |
| 12 million | Tickets created when a chat could not resolve the issue | LiveChat Customer Service Report (2026 data), 2026 |
Two findings are worth sitting with. First, only 6.7% of chats get rated, so CSAT describes the customers who bothered to answer. Second, chatbot-handled chats scored 64.7% against 64.2% overall. Bots are not dramatically better or worse than people on the questions they get; they are roughly equal, and much cheaper per conversation. The CSAT and customer effort score glossary entries cover how to collect enough ratings to trust.
Bots were present in 163 million of the 1.67 billion chats, under 10%. That is low compared with how much routine traffic live chat carries, which suggests most live chat teams still answer "what are your hours" by hand. See our human handoff guide for how teams split the work between bot and agent.
Live chat benchmarks by industry
| Benchmark | What it measures | Source |
|---|---|---|
| Retail: 55s / 74.4% | Retail first response time / retail chatbot satisfaction | LiveChat Customer Service Report (2026 data), 2026 |
| Retail: 18.4 | Chats per agent per day in retail, against 84.1 globally | LiveChat Customer Service Report (2026 data), 2026 |
| Software: 58.7 / 59.2% | Chats per agent per day / chatbot satisfaction in software and services | LiveChat Customer Service Report (2026 data), 2026 |
| Finance: 66.2% | CSAT in financial services, with a 4m 8s queue wait | LiveChat Customer Service Report (2026 data), 2026 |
| Finance: 75.7% vs 83.2% | CSAT at small (1 to 9) versus mid-sized (50 to 99) financial teams | LiveChat Customer Service Report (2026 data), 2026 |
| Real estate: 74% / 16.4% | Real estate CSAT / queue dropout rate | LiveChat Customer Service Report (2026 data), 2026 |
| Real estate: 11h 3m | Daily chat availability in real estate, against 17h 58m globally | LiveChat Customer Service Report (2026 data), 2026 |
Industry splits change the picture. Retail bots score 74.4% satisfaction, the best of any segment, because retail questions are transactional: order status, returns, stock. Software and finance bots score 59.2%, because users bring complex or sensitive problems that need a person. Real estate stands out for high satisfaction (74%) despite only 11 hours of daily availability, which leaves out-of-hours leads unanswered.
If you are in one of these sectors, our industry pages cover typical bot flows: ecommerce, real estate, software and insurance.
What customers expect from live chat in 2026
| Statistic | What it measures | Source |
|---|---|---|
| 74% | Consumers who now expect customer service to be available 24/7 | Zendesk CX Trends 2026, Nov 2025 |
| 81% | Consumers who want an agent to continue the conversation without backtracking | Zendesk CX Trends 2026, Nov 2025 |
| 74% | Consumers frustrated when they have to repeat information | Zendesk CX Trends 2026, Nov 2025 |
| 86% | Consumers who say responsiveness and accurate resolution strongly influence purchases | Zendesk CX Trends 2026, Nov 2025 |
| 76% | Consumers who would choose a company that allows text, images and video in one thread | Zendesk CX Trends 2026, Nov 2025 |
| 87% | Customers who say a human option is essential when a company uses GenAI | Gartner survey of 3,566 customers, Aug 2026 |
| 45% | Consumers more likely to use an AI agent if there is a clear escalation path | Salesforce State of the AI Connected Customer, Oct 2024 |
Expectations have outgrown business hours. 74% of consumers expect 24/7 service, yet LiveChat's average business is reachable for just under 18 hours. The usual answer is a bot that covers nights and weekends, answers what it can and collects details for the morning. Our guide to after-hours support shows how teams set that up without promising a person who is not there.
Continuity is the other demand. Customers want the conversation to carry on without starting over, whether it moves from bot to agent or from chat to email. That means one inbox and one history, not separate tools.
Where support teams are investing
| Statistic | What it measures | Source |
|---|---|---|
| 35.5% | Businesses investing in expanding live chat in 2026, second only to self-service at 48.6% | Freshworks 2026 Customer Service Benchmark, 2026 |
| 9m 21s to 4m 36s | Average resolution time as AI agents take a larger share of conversations | Freshworks 2026 Customer Service Benchmark, 2026 |
| 11m 16s to 7m 28s | Average response time at low versus high AI copilot adoption | Freshworks 2026 Customer Service Benchmark, 2026 |
| 53% / 42% | Teams saying service is decisive in winning customers / directly shapes renewals | Freshworks benchmark takeaways, 2026 |
Freshworks' 2026 benchmark puts live chat second among channel investments, behind self-service. The two work together: self-service and an AI agent answer first, live chat takes over when they cannot. The resolution-time data shows why teams are adding AI in front of chat rather than more agents behind it. For the full AI picture, see AI customer service statistics.
Applying the benchmarks to your own live chat
Use the benchmarks as targets, then fix the biggest gap first:
- First response over a minute? Add an instant bot greeting that answers common questions and tells people what happens next.
- Queue dropout above 25%? Let the bot take routine questions so the queue only holds complex ones, and offer to continue by email if wait times climb.
- Coverage under 24 hours? Run the bot overnight and route anything it cannot handle into a ticket.
- Low rating volume? Ask for a rating in the chat itself, right after resolution.
Setting up chat from scratch? Our step-by-step guide to setting up live chat on your website covers the basics, including platform guides for WordPress and Shopify.
Live chat metrics explained
| Metric | What it means and how to read it |
|---|---|
| First response time | Time from the customer's first message to the first reply. LiveChat's benchmark is 35 seconds. |
| Average handle time | Total time an agent spends on a conversation. LiveChat's average chat lasts 8 minutes 25 seconds. |
| CSAT | Share of satisfied ratings. Only 6.7% of chats get rated, so collect ratings deliberately. |
| First contact resolution | Issues solved in the first chat without a follow-up ticket. |
| Canned responses | Saved replies for common questions. A bot is the automated version. |
| Chat widget | The window on your site where chat happens. 94.2% of chats happen on mobile. |
| Omnichannel support | One conversation history across chat, email and messaging, which is what removes the need to repeat information. |
| Customer self-service | Help customers find without contacting you. Freshworks found it is the top investment priority for 2026. |
Staffing math from the benchmarks
The benchmarks are useful for rough staffing. LiveChat's average business handled 6,794 chats a month. At the global average of 84.1 chats per agent per day, that is about three agents' worth of daily capacity, but only if those agents are fully loaded with simple chats, which is the opposite of what you want.
| Scenario | Monthly chats | Bot answers | Left for people | What it means |
|---|---|---|---|---|
| No bot | 6,794 | 0% | 6,794 | Every routine question waits in the queue |
| Bot answers routine questions | 6,794 | 40% | 4,076 | The queue holds fewer, harder conversations |
| Mature bot | 6,794 | 60% | 2,718 | People handle complex cases and the overnight backlog |
The 40% and 60% rows are illustrations, not benchmarks; your share depends on how many questions repeat. Run your own figures in the chatbot cost calculator, and see our small business chatbot guide for where to start.
Live chat beyond the website
Live chat used to mean a widget on your site. Customers now start the same conversations in messaging apps: Meta reports more than a billion active threads with business accounts every day. Handling both in one inbox is what keeps the 81% of consumers who want continuity happy. See our WhatsApp Business statistics and Messenger and Instagram statistics for the messaging side, and WhatsApp and Messenger for how Conferbot connects them.
Widely quoted numbers we left out, and why
Live chat numbers circulate especially widely. These ones we could not verify at the source:
| Figure you may see elsewhere | Why it is not in our table |
|---|---|
| CSAT peaking at 84.7% when the first reply comes within 5 to 10 seconds | Attributed to LiveChat or SQM Group on aggregator sites; we could not find it on LiveChat's current report page. |
| Visitors waiting 22.8 seconds for an agent, from a 2026 chat benchmark | We could not open the original report to confirm the figure and its method. |
| "80% of live chats are answered within 40 seconds" | Repeated without a dated report link. |
| Live chat conversion lift percentages | Usually from single vendor case studies without a stated baseline. |
For satisfaction measurement that you can trust in your own data, see the customer effort score entry and our KPI formulas.
How we sourced these live chat statistics
The benchmark figures come from LiveChat's Customer Service Report, which describes the businesses using its product. LiveChat states the data was last updated in 2024. We did not use figures we could only find on aggregator sites, including several widely repeated response-time and satisfaction claims whose original source we could not open. Expectation data comes from Zendesk CX Trends 2026, Gartner and Salesforce; investment data from Freshworks' 2026 benchmark.
Sources on this page:
Live chat and a bot in one inbox
Conferbot combines both halves of these benchmarks: an AI bot on your website widget that answers instantly from your knowledge base, and live chat handover into a shared inbox when a person is needed, with the whole conversation attached. The same inbox covers WhatsApp and the other channels you connect, all available on every plan including Free. Compare plans on the pricing page or start from the free plan.
Start free with Conferbot - the free plan includes 600 conversations a month and needs no credit card, so you can have a bot answering on your busiest channel this afternoon.
Was this article helpful?
Build and deploy in 10 minutes. No coding needed.
Live Chat Statistics 2026 FAQ
Everything you need to know about chatbots for live chat statistics 2026.
About the Author
The Conferbot team writes about building, deploying, and improving AI chatbots.
View all articles

